The blog explores how geospatial technology and AI empower effective environmental monitoring, particularly in agriculture. It highlights the role of remote sensing in studying Earth’s land cover changes, emphasizing the importance of LULC classification for sustainable land use planning and agricultural development. Additionally, it showcases Cropin’s AI-driven approach to LULC mapping, offering tailored solutions for stakeholders to optimize operations and make informed decisions in the agricultural sector.
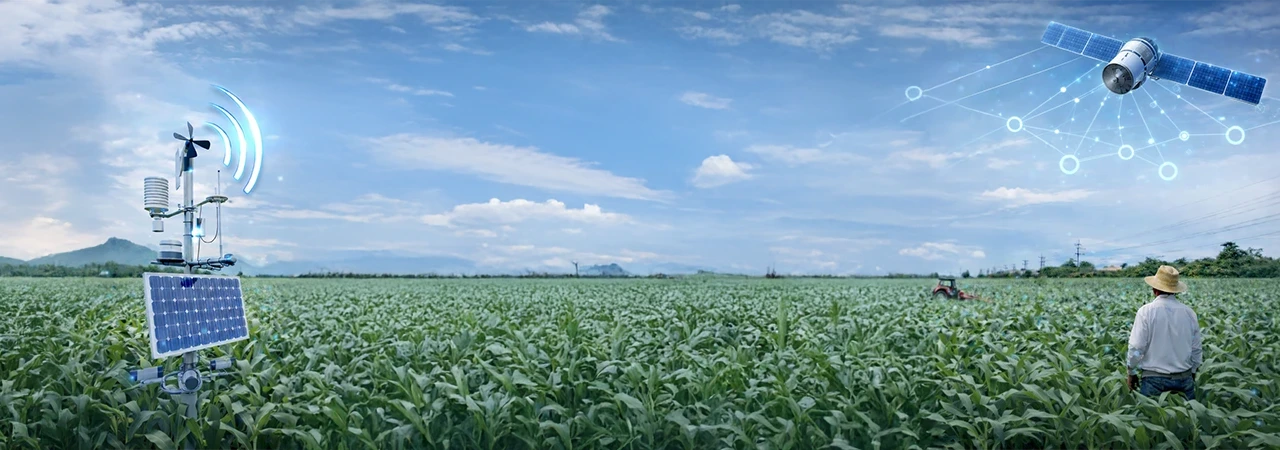
Advancements in geospatial technology and the increasingly groundbreaking use of artificial intelligence and deep learning enable a scientific, data-driven approach to effective environmental monitoring. Remote sensing technologies are enabling the study of changes in Earth’s land cover, which includes vegetation, water surfaces, and man-made features, as well as various land-use patterns.
Human activities in the past few centuries have accelerated and intensified the transformation of the Earth’s surface. In this light, classifying and evaluating Land Use and Land Cover (LULC) patterns are critical to global monitoring studies, environmental conservation, land use planning, resource management, and sustainable development worldwide.
Arable land is the primary and most essential input for agriculture, and it is needless to say that producing enough food, feed, and fiber for the world’s population would be impossible if land for agricultural purposes is not enough. For this reason, analyzing the distribution of arable land becomes imperative to determine the availability of land for farming purposes in different regions, and consequently boost agricultural production the world over.
Forests stand as our guardians against climate change, purify our air and water, and nurture biodiversity. Deforestation, their silent adversary, threatens the lungs of our planet, as well as the very foundation of agriculture itself. Losing forests means losing fertile soil, disrupting rainfall patterns, and jeopardizing the delicate balance that sustains healthy crops. Accessing and controlling deforestation isn’t just about protecting pristine landscapes; it’s about safeguarding the future of agriculture, and with it, the future of food security for generations to come.
LULC refers to the physical and functional characteristics of the Earth’s surface. Land Use denotes human activities, while Land Cover describes the physical surface. LULC models are algorithms that help understand changes in land use and land cover patterns over time.
These models play a crucial role in understanding and managing human and environmental impacts on landscapes, particularly in the context of agriculture, urban development, and climate change.
Why do agri-businesses need it?
- Implement responsible sourcing: It helps businesses identify deforestation and ensure responsible sourcing
- Identify optimal locations: The model pinpoints areas with ideal characteristics, water availability, and climate that are best suited for expansion of a given crop
- Reduce risks: By mapping areas prone to floods, droughts, or pests, the company can avoid risky locations, saving resources and preventing losses
- Support sustainable practices: LULC models can help identify areas for conservation or reforestation, promoting ecosystem health and long-term land productivity
How cropin does land cover classification?
Cropin’s AI-powered engine classifies land usage based on the land use classification system developed by the United State Geological Survey (USGS). This system classifies land use and land cover into multiple levels, the categories in each forming a nested hierarchy of sub-categories. For instance, Agriculture, which is one of the broad categories in Level I, includes detailed categories such as ‘Cropland and Pasture’, ‘Orchards, Groves, Vineyards, and Nurseries’, and ‘Confined Feeding Operations’. While Level I categories are of LANDSAT type data, Level II categories are high altitude data (12400m or above) with better spatial, spectral, and temporal resolutions.
The LULC mapping by Cropin is based on Level I of the USGS system that is relevant for regional and various large-scale applications. Cropin’s engine adopts five of the nine sub-categories in Level I, viz agricultural land, barren land, built-up or urban land, forest, and water bodies.
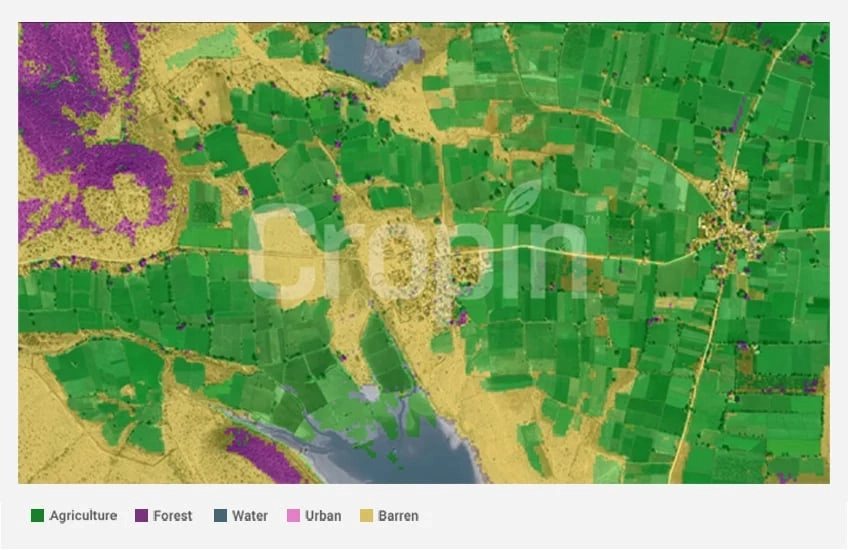
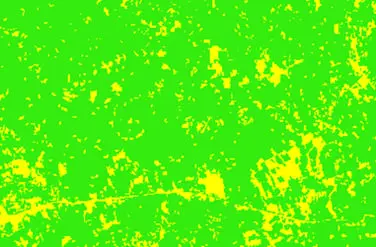
LULC map of a region in northwestern Madhya Pradesh
Cropin’s land use and land cover with AI and deep learning:
Data ingestion: As the first step, raw Sentinel-1 and Sentinel-2 satellite images are fetched for a given region of interest.
Image pre-processing: Cloud masking and interpolation are applied on Sentinel-2 satellite images.
- Supervised learning models: Trained on labeled data with known land cover types, these models learn to classify new images based on their extracted features.
- Outlier removal: A two-step outlier removal process identifies and removes pixels that could introduce errors, ensuring cleaner data for classification.
- Model refinement: The repeated sanitizing of data points results in pure pixels where ‘Built-up/Urban’ does not include any water body, or there is no presence of ‘Barren Land’ within ‘Agriculture Land’.
- Accuracy enhancement: The models are tested for accuracy and retrained using various methods to achieve at least 90% accuracy.
- Accuracy Audit: Following the LULC classification, the results undergo thorough auditing to ensure high accuracy.
- Agricultural Land Extraction: Utilizing Cropin’s intelligence models, the land use map specifically focuses on agricultural areas. It is observed that few pixels of shrubs, grass and sparse vegetation are mis-classified as cropland. To overcome this issue, an active vegetation mask is generated using NDVI and DEM data. This active vegetation layer contains two classes – active vegetation & non-active / no vegetation. This layer is overlaid with the classification output to generate two classes – agriculture land & non-agriculture land.
- Interactive Map-based Dashboard: The extracted agricultural land data is visualized on an interactive map-based dashboard.
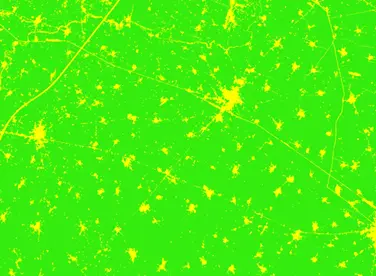
Examples of LULC mapping done by Cropin
Alwar, Rajasthan, India (LULC)
Alwar, Rajasthan, India (basemap)
Kenya (LULC)
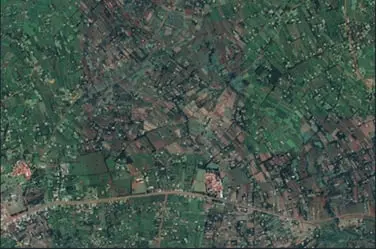
Kenya (basemap)

Legends
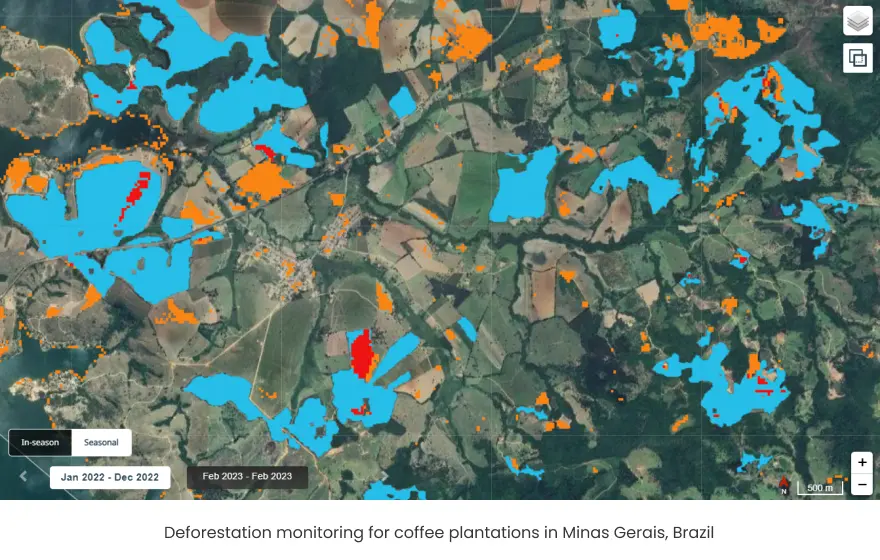
Unlocking deforestation insights: Cropin’s multi-model approach
- Global Forest Change Maps (Hansen Data): Annually updated with high accuracy in detecting forest loss/gain.
- Tropical Moist Forest Maps: Offers detailed information on deforestation and forest degradation and further conversion of these into other land cover types.
- Palsar Forest Maps: Provides forest information generated by classifying the Synthetic Aperture Radar image based on the strength of the backscatter, which in turn depends on tree/forest characteristics.
To clearly differentiate plantations from natural forests, Cropin employs a two-step approach:
- Combined Analysis: We utilize the forest layer from LULC data in conjunction with the chosen maps to create a comprehensive picture of forest cover.
- Plantation-Specific Data: We integrate our exhaustive crop knowledge graph and other data to specifically identify plantations, ensuring a more accurate assessment of deforestation trends.
This multi-model approach enables Cropin to provide a more nuanced and reliable understanding of deforestation, empowering stakeholders with valuable insights for informed decision-making.
- Regional analysis: Explore land use patterns across different areas within the region
- Crop identification: Based on user requirements, specific crops grown in particular locations can be identified and highlighted
- Customization: Users can personalize the display to focus on specific parameters of interest
Beyond the standard: why cropin’s LULC delivers superior accuracy
Cropin’s Land Use and Land Cover (LULC) data doesn’t settle for the generic. We go beyond pre-trained models, crafting solutions tailored to individual regions and needs. This meticulous approach unlocks exceptional accuracy and insights.
Here’s how we achieve it:
Geography-Specific Models: We begin with our pre-trained LULC models, but don’t stop there. We fine-tune them for specific geographies, accounting for local variations in land cover and agricultural practices. This customization ensures our models understand the nuances of your environment.
Crop Knowledge Graph Integration: Our unique advantage lies in our exhaustive crop knowledge graph. By incorporating this wealth of information into our models, we recognize even subtle distinctions between different crops and land uses, further enhancing accuracy.
Ground Truth Advantage: We harness the power of ground data points, allowing us to continuously “teach” and refine our models. This ongoing learning process leads to smarter and more accurate predictions over time.
Human-Supervised Learning: Each custom-trained model is based on an algorithm supervised by our AI experts and data scientists, who guide the learning process. This human oversight ensures the model stays on track and delivers highly accurate results.
Continuous Refinement: We believe accuracy is a journey, not a destination. That’s why we regularly retrain our LULC models with fresh ground truth data, ensuring they remain adaptable and precise even as landscapes evolve.
Active Vegetation data: Cropin generates comprehensive seasonal and real-time LULC maps. These detailed maps enable the identification of various crops planted during different seasons and periods when land is left fallow for soil preparation. As a result, Cropin’s detailed active vegetation data is vital for informed agricultural decision-making.
Through this comprehensive approach, Cropin’s LULC solutions deliver unmatched accuracy, empowering you with reliable data to make informed decisions that drive agricultural success.
How does this translate into value for agri-stakeholders?
LULC, which is up-to-date and reliable information, has many advantages in the agri-domain, particularly when used by governmental bodies and agri-lending institutions to develop effective agrarian policies.
Cropin Intelligence facilitates key stakeholders in governmental bodies to determine the availability of agricultural land in a given region (at farm/postcode/state/country level) for that particular season. The intelligent platform also establishes the historical performance of the region, which allows users to compare current data with records to examine LULC changes due to urbanization, encroachment, or severe weather events in the region. Other activities such as planning water supply for irrigation needs, also become effective using this cutting-edge platform’s LULC capabilities.
On the other hand, food processing companies can identify regional agricultural land distribution. From this, they can identify areas with high concentrations of the target crop for sourcing, enabling smarter purchasing decisions based on real-time data availability. No more guesswork, just strategic sourcing based on data-driven insights. LULC data provides crucial insights to plan expansion strategies for these companies.
Commodity Traders can predict price fluctuations with greater accuracy by understanding regional crop production potential. Intelligence from LULC data serves as the first input to unveil planting trends and growing conditions. It offers an edge to anticipate market shifts and make informed trading decisions.
Farming companies can identify ideal growing grounds with soil characteristics, water availability, and climate perfectly suited for chosen crops. Using LULC maps, ideally suited crop varieties can be chosen to maximize yields with data-driven precision.
Seed manufacturers and other agri-input companies can optimize their sales strategies based on the net sown area and crop classification data made available on Cropin Intelligence dashboard. The knowledge of what crop grows where, and what its crop stage and health looks like, empowers input companies to make their products available at the nearest distribution points.
Banking, insurance, and other financial institutions can analyze the net sown area at a regional level to decide on their lending policies and expansion of business to new regions. At a plot level, data on the Cropin Intelligence dashboard helps institutions identify whether a farm is being cultivated and leverage records of the historical performance of the plot for quicker loan underwriting and risk assessment backed by alternate agri-data.
By harnessing the power of LULC data, every player in the agricultural chain can unlock valuable insights, optimize operations, and make informed decisions for more efficient and sustainable operations.
This article was updated on March 2024.