


Normalized Difference Vegetation Index or NDVI is not a new concept, and it has been in use since 1973, aiding scientists to assess and monitor plant health in no time. Today, NDVI has become the most commonly used vegetation index in remote sensing, especially with the recent advancements in earth observation and drone technologies.
In this blog post, you will get a closer look at what exactly NDVI is and the ample scope for its applications in precision agriculture.
What is NDVI or Normalized Difference Vegetation Index?
NDVI or Normalized Difference Vegetation Index is a remote sensing method that uses the reflectance of light in the visible and near-infrared (NIR) wavelengths to determine the amount and health of vegetation in an area. NDVI is widely used in agriculture, forestry, and ecology to monitor the growth and health of vegetation and to identify areas of stress or damage. NDVI values can also be used to map and classify vegetation types, and to detect changes in vegetation cover over time.
Simply put, the Normalized Difference Vegetation Index is an indicator of a plant’s health entirely based on how the cell structures reflect the different light waves in visible and near-infrared bands.
In other words, it aids in detecting and quantifying the presence of live green vegetation based on how objects interact with light. To understand the plant’s health condition, one needs to compare the absorption and reflection values of red and NIR (near-infrared) light. Here is where NDVI comes into the picture.
How is NDVI calculated?
Plants have a unique reflectance characteristic, they reflect more near-infrared (NIR) light and absorb more visible light. When plants are healthy, they have a high chlorophyll content, which allows them to absorb more light in the red region of the spectrum and reflect more light in the NIR region. So NDVI uses this characteristic of plants to differentiate healthy vegetation from non-vegetation or unhealthy vegetation.
NDVI is calculated by subtracting the reflectance of the NIR band from the reflectance of the red band and then dividing that value by the sum of the reflectance of the NIR and red bands. NDVI values range from -1 to 1, with -1 indicating no vegetation, 0 indicating bare soil or water, and values closer to 1 indicating greater amounts and healthier vegetation.
In mathematical terms, comparing the red and near-infrared light signals can help differentiate between healthy and sick plants or distinguish non-plants from plants.
Take a look at the formula below for the evaluation of NDVI:
NDVI = (NIR-Red)/(NIR+Red)
Now, the values range from -1 to +1. A higher or more positive value indicates greater plant vigor and general health.
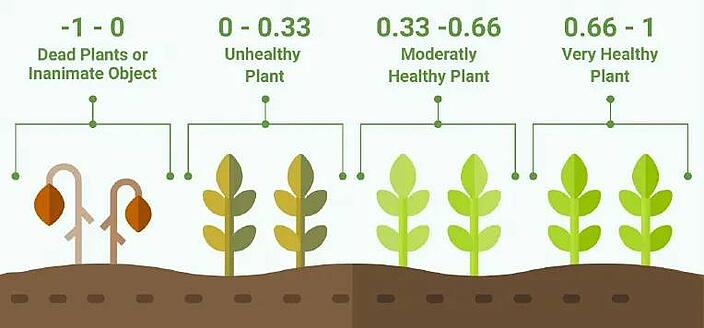
Generally, healthy vegetation, which contains a good measure of chlorophyll and cell structures, tends to absorb a significant amount of visible light while reflecting NIR light. On the other hand, unhealthy vegetation does the opposite; it reflects more visible light while absorbing the NIR light. NDVI allows differentiating vegetation from non-vegetation or unhealthy vegetation using the unique reflectance characteristic of healthy plants and thus allows monitoring the growth and health of vegetation and identifying areas of stress or damage.
But do you know when NDVI was discovered?
A brief history of NDVI
NDVI (Normalized Difference Vegetation Index) is a remote sensing method that was first developed in the 1970s. The concept of using the reflectance of light in the visible and near-infrared (NIR) wavelengths to determine the amount and health of vegetation was first proposed by a scientist named Rouse, in 1973. He used two filters, one to detect the red light and one to detect the near-infrared light. He calculated NDVI by subtracting the reflectance of the NIR band from the reflectance of the red band and then dividing that value by the sum of the reflectance of the NIR and red bands.
In the 1980s, NDVI was further developed and applied to satellite imagery, enabling large-scale monitoring of vegetation cover. The first NDVI images from satellites were generated in the early 1980s and were used to map and classify vegetation types and monitor vegetation cover changes.
In the 1990s, NDVI was used to monitor vegetation health and productivity in agriculture and was also applied to the monitoring of forest and rangeland ecosystems. With the advent of high-resolution satellite imagery and unmanned aerial vehicles (UAVs), NDVI has become increasingly accessible and widely used in a variety of applications such as precision agriculture, land use and land cover mapping, and monitoring of ecosystem health.
Today NDVI is widely used in many applications such as monitoring of crops, vegetation health, precision agriculture, land use and land cover mapping, and monitoring of ecosystem health.
Applications of NDVI
Normalized Difference Vegetation Index (NDVI) is a widely used remote sensing technique with a variety of applications in agriculture, forestry, and environmental monitoring. Some specific examples of how NDVI is used in these fields include
1. NDVI in Agriculture
NDVI is commonly used to monitor the health and productivity of crops. It can help farmers identify areas of the field that may be stressed or experiencing nutrient deficiencies, and can be used to optimize irrigation and fertilization practices. NDVI can also be used to monitor the growth and development of crops over time, and to estimate yields.
NDVI can also be used in precision agriculture, which is the use of technology to optimize crop management decisions. NDVI values can be used to identify variations in crop growth and health, and to target specific management practices, such as fertilization and irrigation, to areas of the field that need it most. This can lead to more efficient use of resources and can improve crop yields and quality.
2. NDVI in Forestry
NDVI can be used to assess the density and health of forests, and to monitor changes in forest cover over time. It can help identify areas of the forest that may be experiencing stress or damage due to pests, diseases, or other factors. NDVI can also be used to estimate the biomass and carbon sequestration potential of forests. NDVI can be used to monitor the health of forests over large areas, by detecting changes in vegetation cover, such as changes in canopy cover, leaf area index, and biomass.
NDVI can be used to detect changes in forest structure, such as changes in the density of trees, and to identify areas of forest regeneration. NDVI can also be used to monitor the effects of forestry management practices, such as clear-cutting, thinning, or prescribed burning, on forest growth and health.
NDVI values can be used to identify areas that are recovering well from management practices, and to detect areas that are not recovering as well. NDVI can be used in combination with other data sources such as LiDAR data to gain more detailed and accurate information about forest structure and biomass. With the increasing use of UAVs, NDVI data can be obtained more frequently, cost-effectively, and efficiently.
3. NDVI for Environmental Monitoring
NDVI can be used to monitor the health and productivity of vegetation in natural ecosystems, such as grasslands, savannas, and wetlands. It can be used to detect changes in vegetation cover due to human activities or natural events, such as deforestation, land use change, and drought. NDVI can also be used to monitor the recovery of vegetation after disturbances, such as fires or floods.
NDVI can be used to detect changes in vegetation cover, such as changes in canopy cover, leaf area index, and biomass. NDVI can also be used to detect changes in ecosystem structure, such as changes in the density of vegetation, and to identify areas of ecosystem regeneration.
NDVI can also be used to monitor the effects of environmental management practices, such as restoration, conservation, or reforestation, on ecosystem health. NDVI values can be used to identify areas that are recovering well from management practices, and to detect areas that are not recovering as well.
Let us now take a look at the various applications of NDVI in agriculture.
5 top practical Applications of NDVI in Agriculture
Did you know that NDVI can tell a lot about the crop based on seasonal changes?
For example, it helps understand how the plant survived throughout the winter. A value lower than 0.15 indicates that all plants perished in that particular part of the field.
Besides generalized assessment, some of the other practical uses of NDVI in agriculture are as follows:
1. NDVI aids in tracking Crop Health
Most scientists and agronomists prefer NDVI as an ideal tool for tracking crop health. Primarily, they capture a series of NDVI maps to keep a close check on crop health. It is applicable during the growing season and from year to year.
These NDVI values, when averaged, can help determine the normal growing conditions of crops in a particular area and at a given time of the year.
NDVI data can be used to identify nutrient deficiencies in crops. For example, low NDVI values in certain areas of the field may indicate that the crops in those areas are experiencing a deficiency of a specific nutrient, such as nitrogen or phosphorus. This information can help farmers to target fertilization practices to address the deficiency and improve crop health.
So, what’s the advantage here? With NDVI, you get a closer look at what the naked eye cannot see. It shows you the problem areas in advance, thereby providing you with the opportunity to fix them faster. Of course, NDVI cannot replace human intervention, but it does make the job remarkably simple.
2. NDVI helps Agronomists develop Variable Prescription Maps
With NDVI maps, agronomists and other stakeholders can identify nutrient deficiencies, conduct the much-needed ground-truthing, and then upload the data on a farm ERP solution like Cropin, a revolutionary in promoting and making precision farming possible.
NDVI data can be used to optimize irrigation schedules by identifying areas of the field that are most in need of water. For example, if NDVI values are lower in certain areas of the field, this may indicate that the crops in those areas are stressed and may benefit from additional irrigation.
Consequently, farmers and farming companies need not spend extra anymore. With data-backed advisories from agronomists, they can spray and seed only as needed to save time, money, and resources significantly.
3. NDVI helps Scout Fields Faster
The traditional physical process of assessing or tracking a field can be more detrimental to the crops. Plus, it is time-consuming and labor-intensive nonetheless. On the other hand, with NDVI, you can identify the problem areas sooner and take the necessary steps to improve crop health and yield. An absolute win-win situation for both the farmer and the associated brand!
4. NDVI helps identify crop problems sooner
NDVI also helps agronomists identify stressed crops up to 2 weeks before the naked eye can see. Since crop stress is more apparent in the near-infrared light spectrum than in the visible one, it can aid growers to eliminate pests, diseases, fungi, and arid conditions sooner. In addition, consistently low NDVI values at the same place every crop cycle could indicate problems with drainage, soil pH, or even soil compaction.
Therefore, NDVI is now an indispensable part of precision farming that plays a direct role in maintaining crop health and yield. Cropin, a pioneering agri-tech SaaS-based solution provider, acknowledges this aspect and has developed smart farming solutions that embrace and leverage the benefits of this versatile vegetation index.
5. NDVI helps indicate drought situations
NASA made a case for using NDVI as an indicator of drought. NASA writes on its website, "more a plant is photosynthesizing, the more it is being productive". Conversely, the less sunlight the plant absorbs, it isn't productive." This gives us NDVI values over a period of time. When averaged, the NDVI values give a region's absorption/reflection capacity. Thus, NDVI indicates the health of the vegetation in that area, compared to the average.
Armed with 20 years of NDVI data over the entire globe, NASA can now compare today's NDVI with the 20-year average to reveal if the productivity of a particular region is more, less, or the same. A region which is shown reduced plant growth characterized by lower NDVI values compared to average could be labeled as "in drought." Not always, though. Cloud cover and extreme cold can also cause lower-than-normal NDVI.
NDVI – Not New, But Never Obsolete!
Technologies to generate NDVI data for agriculture
1. Satellite imagery
NDVI can be derived from satellite imagery, which provides a synoptic view of the earth's surface at regular intervals. Satellite sensors such as Landsat, Sentinel-2, and MODIS measure the reflectance of vegetation in different wavelength ranges, which can be used to calculate NDVI. Satellite imagery is widely available and can cover large areas, but the spatial resolution may be limited and the data may be affected by cloud cover.
2. Remote Sensors
NDVI can also be measured directly on the ground using hand-held or vehicle-mounted sensors. These sensors may include spectroradiometers, which measure the reflectance of vegetation in different wavelength ranges, or chlorophyll meters, which measure the amount of chlorophyll in leaves.
Analyzing and Interpreting NDVI data in agriculture
1. Visual interpretation
NDVI data can be displayed as maps or images and can be visually inspected for patterns and trends. For example, healthy crops may be associated with high NDVI values, while stressed or damaged crops may have lower NDVI values. Visual interpretation can be useful for identifying areas of the field that may require further investigation or management.
2. Statistical analysis
NDVI data can also be analyzed using statistical techniques, such as regression analysis or principal component analysis. These techniques can help to identify relationships between NDVI and other variables, such as crop yields or weather conditions.
3. Machine learning
NDVI data can be used as input to machine learning algorithms, which can be trained to identify patterns and make predictions based on the data. For example, a machine learning model could be trained to predict crop yields based on NDVI data or to identify areas of the field that may be experiencing stress or damage.
4. Integration with other agricultural data sources
NDVI data can be combined with other types of data, such as yield data, weather data, or soil data, to gain a more complete understanding of the factors that may be affecting crop health and productivity.
Limitations of NDVI
NDVI is sensitive to variations in atmospheric conditions, such as clouds, haze, and aerosols, which can affect the reflectance of light in the visible and near-infrared (NIR) wavelengths. This can lead to errors in NDVI values and make it difficult to accurately interpret NDVI images.
Another limitation of NDVI is that it is not able to distinguish between different types of vegetation or different states of vegetation health. NDVI values can be similar for different types of vegetation, such as trees and shrubs, and NDVI values can also be similar for healthy and stressed vegetation. NDVI can also be affected by sensor characteristics, such as spatial resolution, spectral resolution, and radiometric resolution, which can influence NDVI values.
NDVI values from different sensors or different bands may not be directly comparable, and the NDVI values can be affected by the sensor’s characteristics. NDVI can also be affected by the sun angle, the NDVI values can be affected by the sun angle, and NDVI values can change depending on the time of day or the time of year when the images are acquired. This can make it difficult to compare NDVI values from different images or to detect changes in vegetation cover over time.
The future of NDVI
Sensors that capture agricultural data for NDVI calculation may include drones, balloons, or small satellites, which provide detailed data at a lower cost than traditional satellites. There is ongoing research and development into new and more advanced sensors that can provide higher resolution, more accurate, and more frequent data.
Currently, NDVI data is often collected at regular intervals and analyzed retrospectively. In the future, there may be more efforts to use NDVI data in real time, enabling farmers and other users to make more timely and informed decisions.
The future of NDVI technology is likely to involve further advancements in sensor technology, such as the use of hyperspectral and multispectral sensors, which can provide more detailed and accurate information about vegetation. Additionally, the integration of NDVI technology with other data sources, such as weather and soil data, will enable more sophisticated analyses and applications, such as precision agriculture and monitoring of ecosystem health. With the increasing use of UAVs and satellites, NDVI will be available to more people, making it more accessible, cost-effective, and efficient.
What are the other vegetation indices Cropin uses to enable precision agriculture?


