


Almost all aspects of our lives — breathing, clothing, shelter, food, etc. — are deeply intertwined with vegetation. Any change in the vegetation structure shows a drastic impact environmentally as well as economically. In recent times, the advancement of GIS, GPS, remote sensing, and precision agriculture has been the primary keys to better crop management. Precision agriculture, for instance, enables enhanced analysis and the identification and management of temporal and spatial in-field crop variability.
Now, no discussion regarding precision agriculture can be complete without Vegetation Index, especially when talking about remote sensing in this type of agriculture. So, read on to know what these vegetation indices are and how they are useful in precision agriculture.
What is a Vegetation Index (VI)?
A Vegetation Index assists in the periodic remote observations of vegetation and has been actively used since 1974. This mathematical expression is a spectral transformation to identify vegetation (in its broader sense) using two or more spectral bands.
Using this algorithm, scientists and other concerned personnel effectively observe photo-centric activities and identify variations in the canopy, in addition to drawing accurate comparisons if needed. It includes assessing various aspects, like crop growth, vigor, biomass, and chlorophyll content.
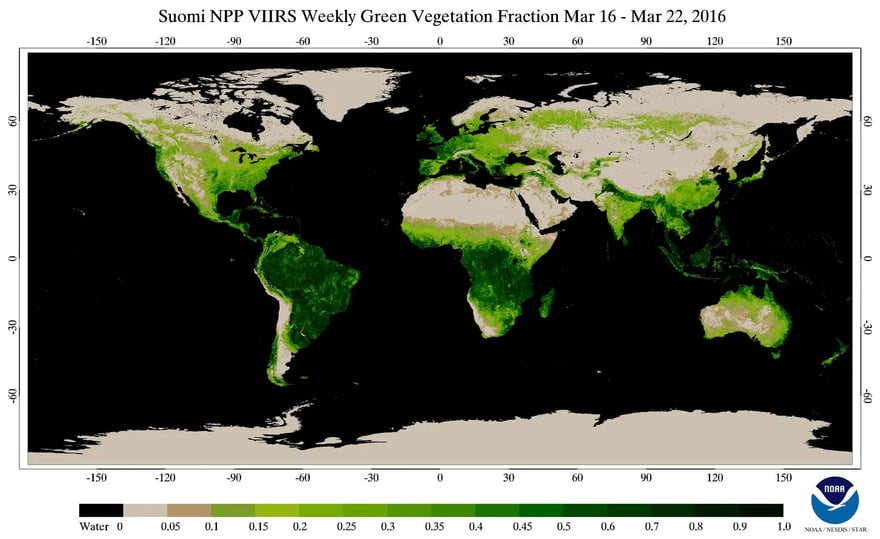
Workings of Vegetation Indices: How are they measured from Space?
The choice of the Vegetation index differs based on its application but all the different indices work on identical optical bands differentiated by colors. Most of them use near-infrared reflectance to identify a relationship with healthy vegetation growth.
For this, scientists use effective remote-sensing techniques. They take readings on attributes like:
- Green cover percentage
- Leaf area index
- Green biomass
- Chlorophyll content
- Absorbed photosynthetically active radiation (APAR), etc., to derive conclusions.
In the last 20 years, the Vegetation index has evolved rapidly, and now Agritech leaders, like Cropin, are implementing its use in the agricultural sector dynamically. With this, vital information like positives and stresses on a piece of land can be easily determined.
Such readings are spatial and are taken from whatever is visible from space or from the near-infrared light reflections from the surface to space. With the use of optical satellite sensors, it is possible to measure solar radiation. As the readings are taken on different bands, multi-spectral optical sensors are used. Each channel in this band is designed so that it is sensitive to a very narrow range of wavelengths color-coded as:
- Blue (450 nm-510 nm)
- Green (510 nm-580 nm)
- Red (630 nm-690 nm)
- Near-infrared (NIR) (770 nm-895 nm)
- Short wave infrared (SWIR) (1100 nm-3000 nm)
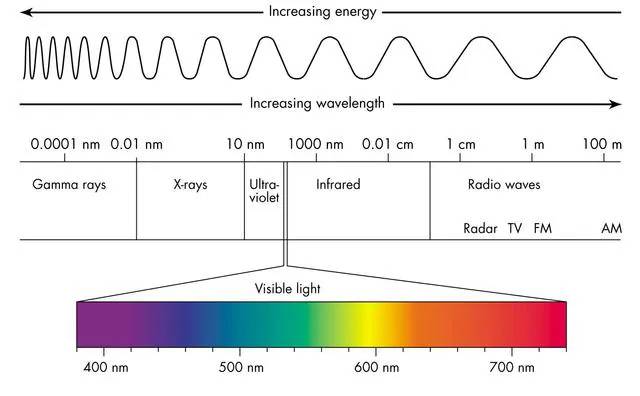
Blue and red bands reflect a vegetation index of lower value and as the value increases, it turns green. On the other hand, those of higher values are read by the near-infrared band.
Different kinds of vegetation index are purposed for specific applications; however, the most common sensors we encounter include Advanced Very High-Resolution Radiometer (AVHRR) and Moderate-resolution Imaging Spectroradiometer (MODIS ) Vegetation 1 and 2 sensors.
The Application of the Vegetation Index in Precision Agriculture
AgTech revolutionaries use the vegetation index actively in precision agriculture. This form of agriculture aims to produce more output with lesser input, and the vegetation index is of immense importance in executing this.
This new-age implementation of VI in precision agriculture offers several benefits, like:
- Physicochemical monitoring: Parameters like greenness, chlorophyll proxy, temperature, evapotranspiration, and soil moisture are derived, which can be further used to leverage optimal plant growth.
- Near-real-time data: It helps offer near-real-time data of a plot or a region to stay updated about the essential parameters without paying a physical visit. It saves time and effort of investigation before taking a management call. Using this real-time data is also helpful to ensure timely actions and take a step toward the expected crop quality.
- Farm activity planning: With Vegetation Index, the timing of sowing, spraying, crop protection, irrigation, harvesting, and other activities can be determined optimally. With information like this, one can take timely calls to optimize input and resource usage as well.
Vegetation Index Mapping can also be effectively used for future references to mark the periodic changes over time.
Examples of Vegetation Indices and how to calculate them
As mentioned before, VIs are of different types (the actual figure is in the hundreds). They are used to suffice different purposes based on remote sensing.
Let us take a look at some of the VIs most widely used at Cropin:
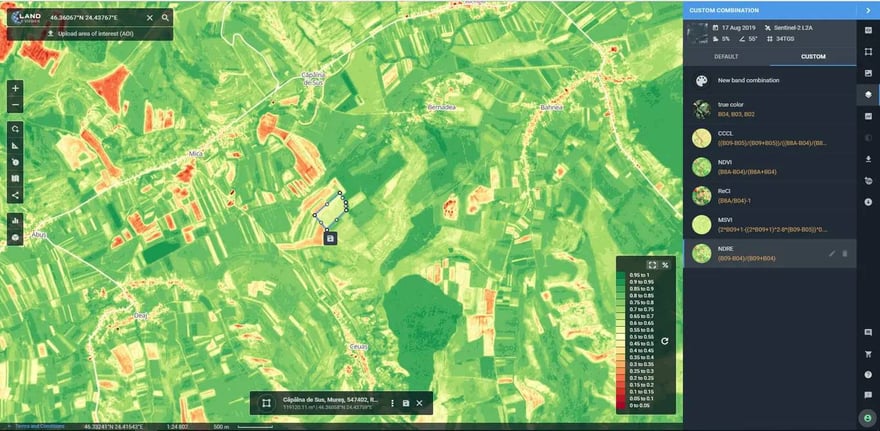
NDVI (Normalized Difference Vegetation Index)
Normalized Difference Vegetation Index or NDVI in agriculture detects the timing of phenological events using visible red and near-infrared reflectance captured by the sensors. It is an extremely popular method and works best when the vegetation is at its biomass peak. NDVI uses Landsat.
Here is the formula: NDVI = (NIR-Red) / (NIR+Red).
However, NDVI does not work well with autumn phenology, whereas top accuracy in observation occurs when there is snow or water on the surface, the latter being a common occurrence on Indian plots.
Source: Phenospex
NDRE (Normalized Difference Red Edge)
NDRE is considered the better version of NDVI as it is much more sensitive. This remote sensing technique is ideal for crops that are in the middle and later stages of growth. The basis of this sensor is an accumulation of chlorophyll.
The reason is that NDRE operates with red-edge light, which passes through a leaf better than the red light used in NDVI. It uses Landsat 8 and operates on red and NIR bands. The reading assists in determining the health of vegetation.
Here is the formula: NDRE = (NIR-RedEdge) / (NIR+RedEdge)
Note that it is still not ideal for crops at an earlier stage of growth.
Source: EOS
VHI (Vegetation Health Index)
Here, the reading is determined using a combination of both Land Temperature Surface (LST) and NDVI. This index, however, may not be ideal for non-arid regions. Instead, it is one of the best VIs used for the analysis of drought.
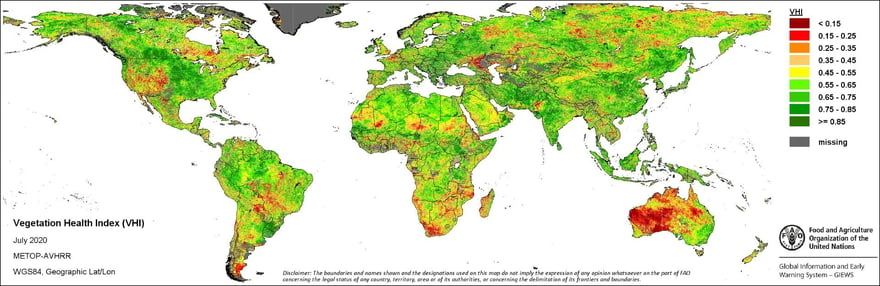
Source: FAO
LAI (Leaf Area Index)
This unit-less index is measured as the one-sided green leaf area per ground area in the case of broadleaf canopies. Considering that a plant has an LAI of 2 implies that it has a number of leaves that can cover the given ground area twice. This data can be used for the whole crop or for a plot to determine growth. LAI uses the popular Sentinel 2.
Here’s the formula: LAI = leaf area / ground area, m2 / m2
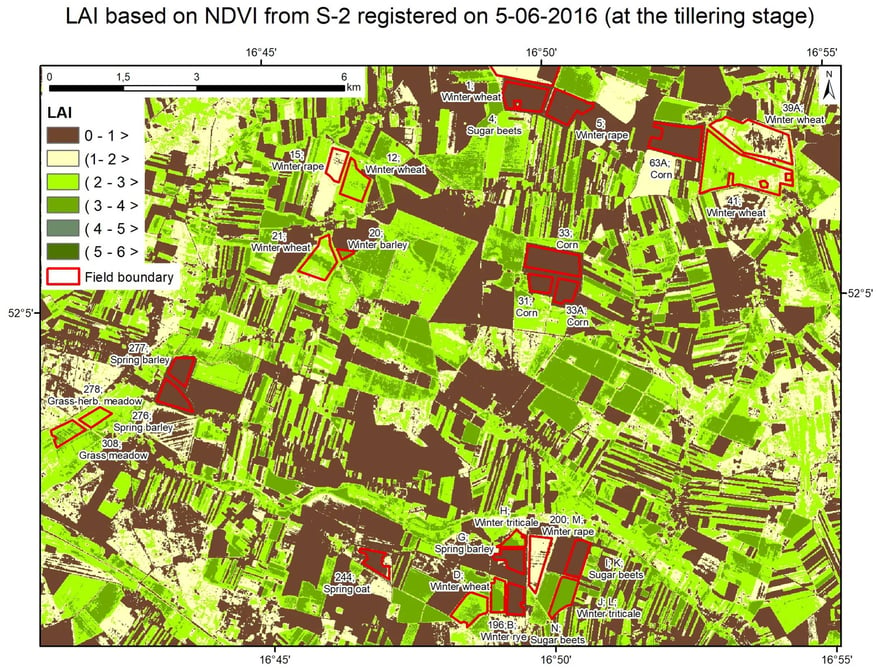
Source: Land Products Validation and Characterisation in support of Proba-V, S-2, and S-3 mission
EVI (Enhanced Vegetation Index)
EVI measures areas with dense canopies, ideally forests. It is not ideal for arid and mountainous areas.
Here’s the formula: EVI = 2.5 * ((NIR – Red) / ((NIR) + (C1 * Red) – (C2 * Blue) + L))
Here, C1 and C2 are correlations to correct for the aerosol scattering in the atmosphere, whereas L is a coefficient to adjust for the soil and canopy background.
This formula works for observations of Landsat 8.
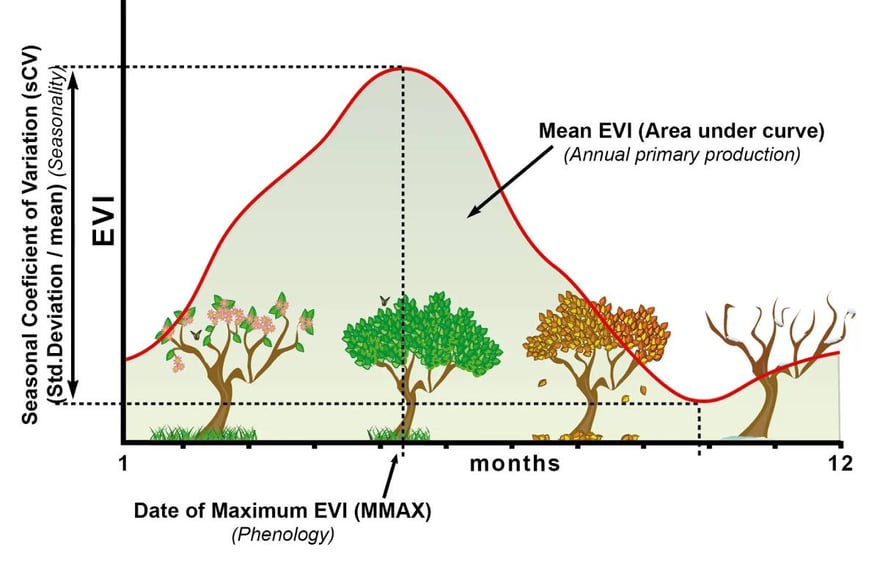
Source: CAESCG, CC BY-SA 4.0, via Wikimedia Commons
GRVI (Green Ratio Vegetation Index)
Scientists developed GRVI to combat the negatives of NDVI. It not only identifies spring but autumn coloring too. Using green and red bands, GRVI employs Landsat mostly. This serves ideally to identify the perfect time of harvest for crops. With GRVI, one can expect precise readings even in the presence of snow and water.
Here’s the formula: GRVI = (Green – Red) ÷ (Green + Red)
NBR (Normalized Burn Ratio)
This Vegetation index is used to identify the burn severity in large fire zones with remote access. Traditionally, the value for this is derived using NIR and SWIR values observed from Landsat. At Cropin, we use the index to detect forest fires and stubble burning, which is an annual event in northern India.
Here’s the formula: NBR= (NIR – SWIR) / (NIR + SWIR)
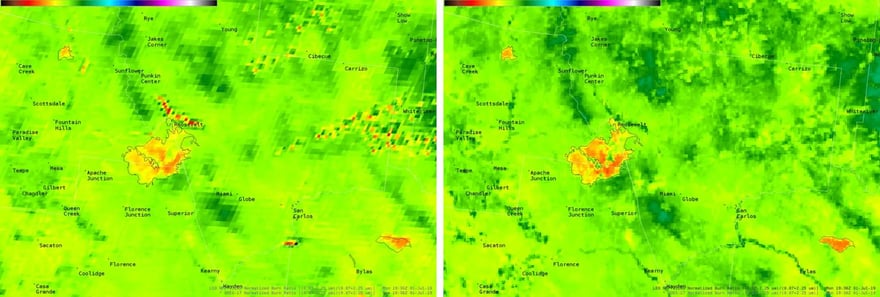
Source: Wide World of Sport
Cropin uses machine learning technologies to implement vegetation indices based on the region and the crop in its smart AgTech products, like SmartFarm and SmartRisk, based on the personalized requirements of an organization.
Rapid improvement in technology is aiding agriculture via reformation in practices which Cropin also customizes in the best possible way to meet the required brand goals. Using such techniques, plot yield will certainly increase, but this can also lower pressure on land, in the long run, thereby meeting the goals of sustainable agriculture.


