Synopsis:
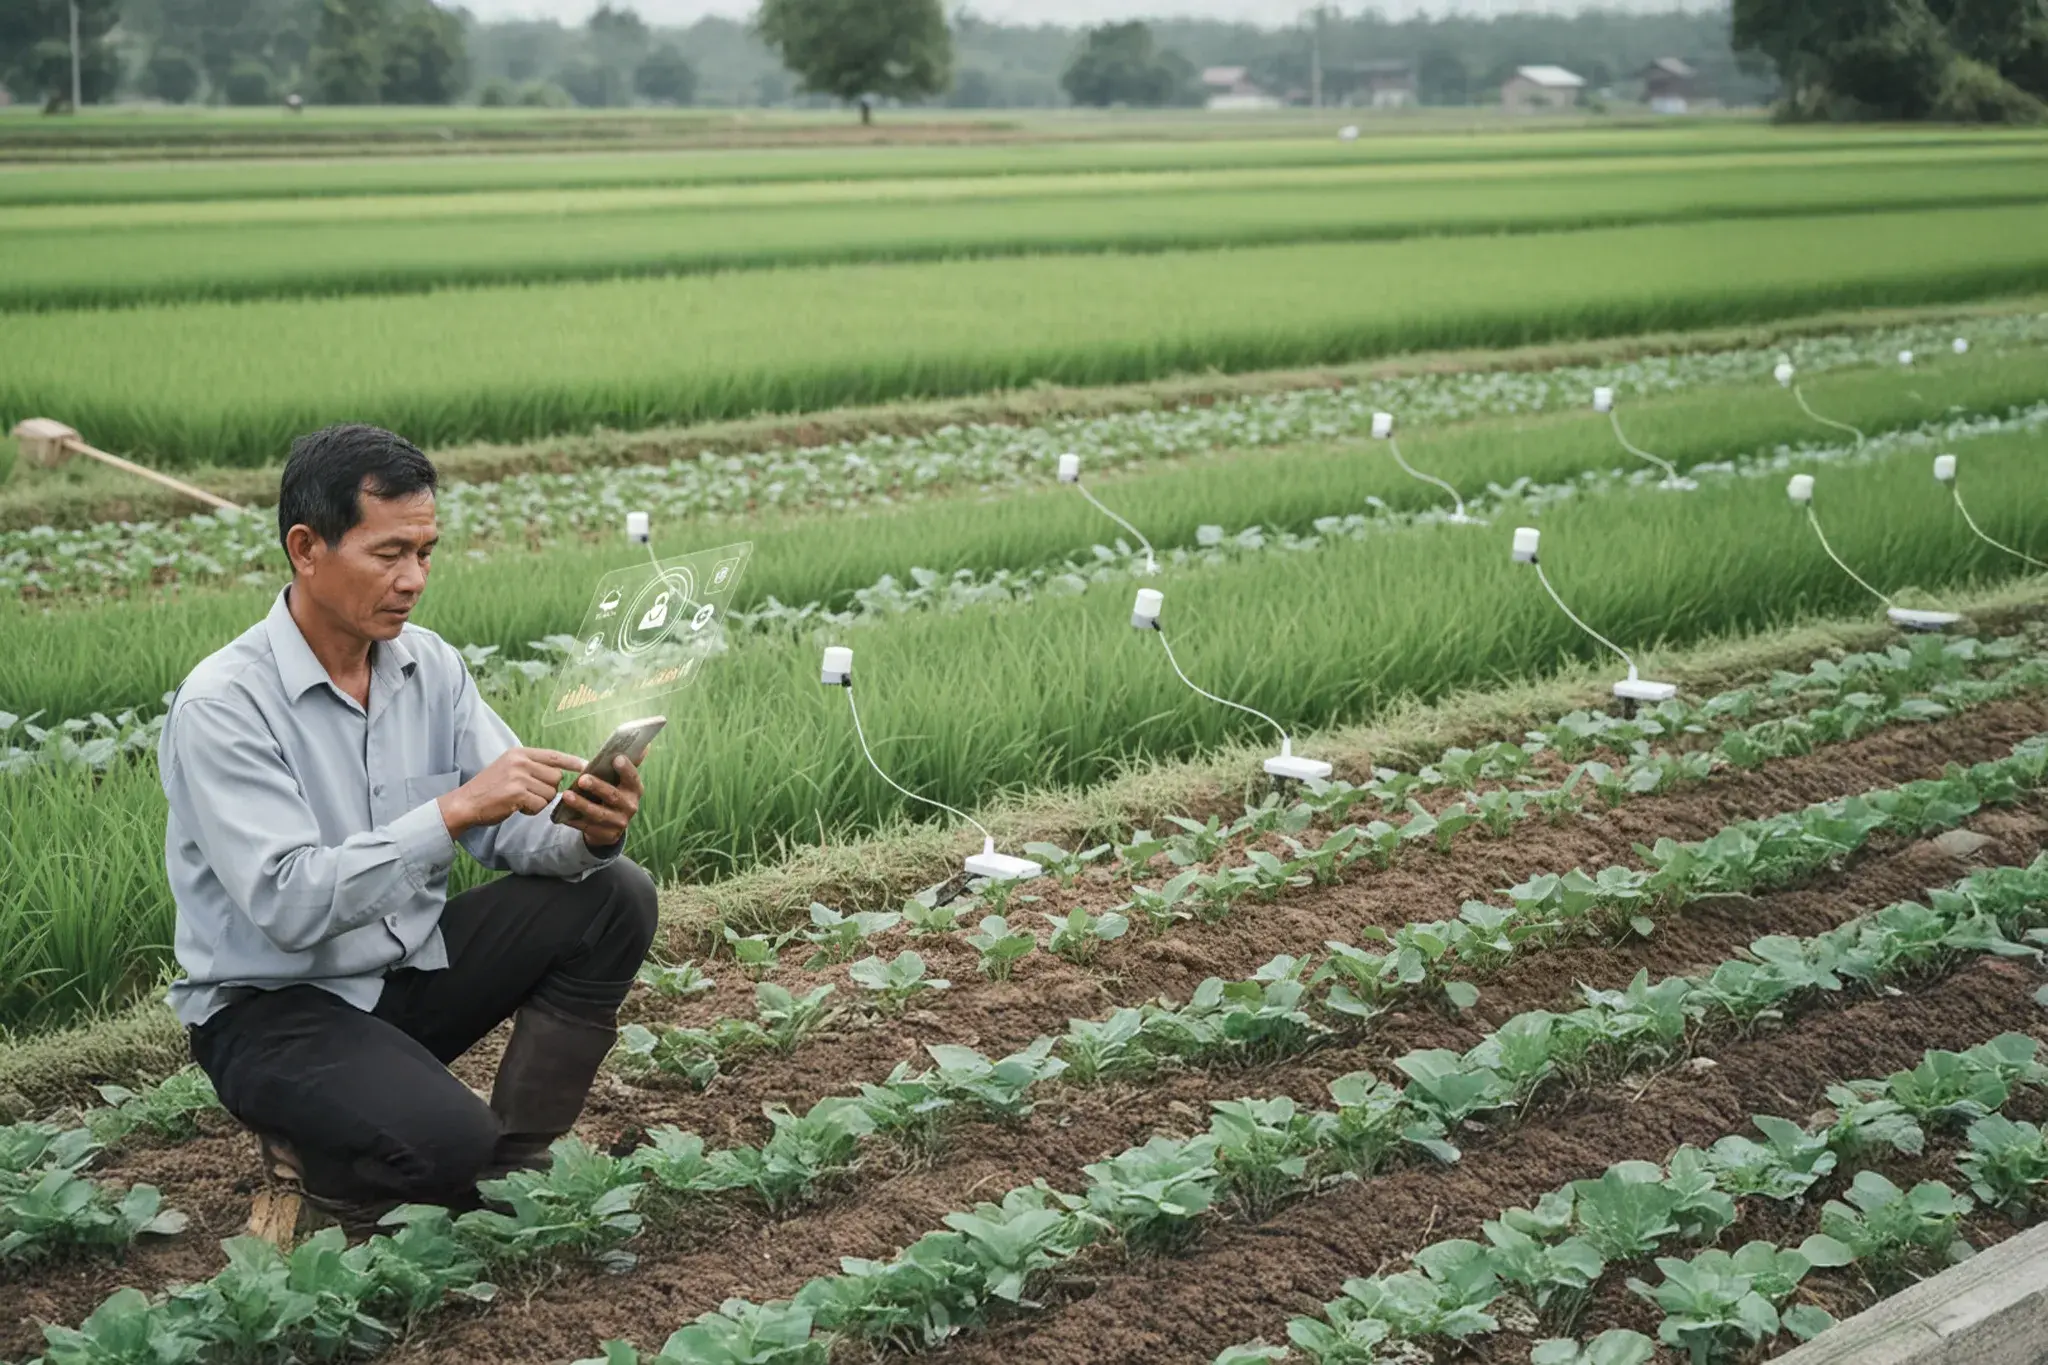
Almost all aspects of our lives — breathing, clothing, shelter, food, etc. — are deeply intertwined with vegetation. Any change in the vegetation structure drastically impacts the environment and economy. In recent times, the advancement of GIS, GPS, remote sensing, and precision agriculture have significantly improved crop management. With detailed analysis and effective management of temporal and spatial variability within fields, precision agriculture ensures optimized input resource usage and improved crop performance.
No discussion on precision agriculture can be complete without addressing the Vegetation Index, especially in the context of remote sensing. Continue reading to learn about these vegetation indices and their significance in precision agriculture.
What is a vegetation index (VI)?
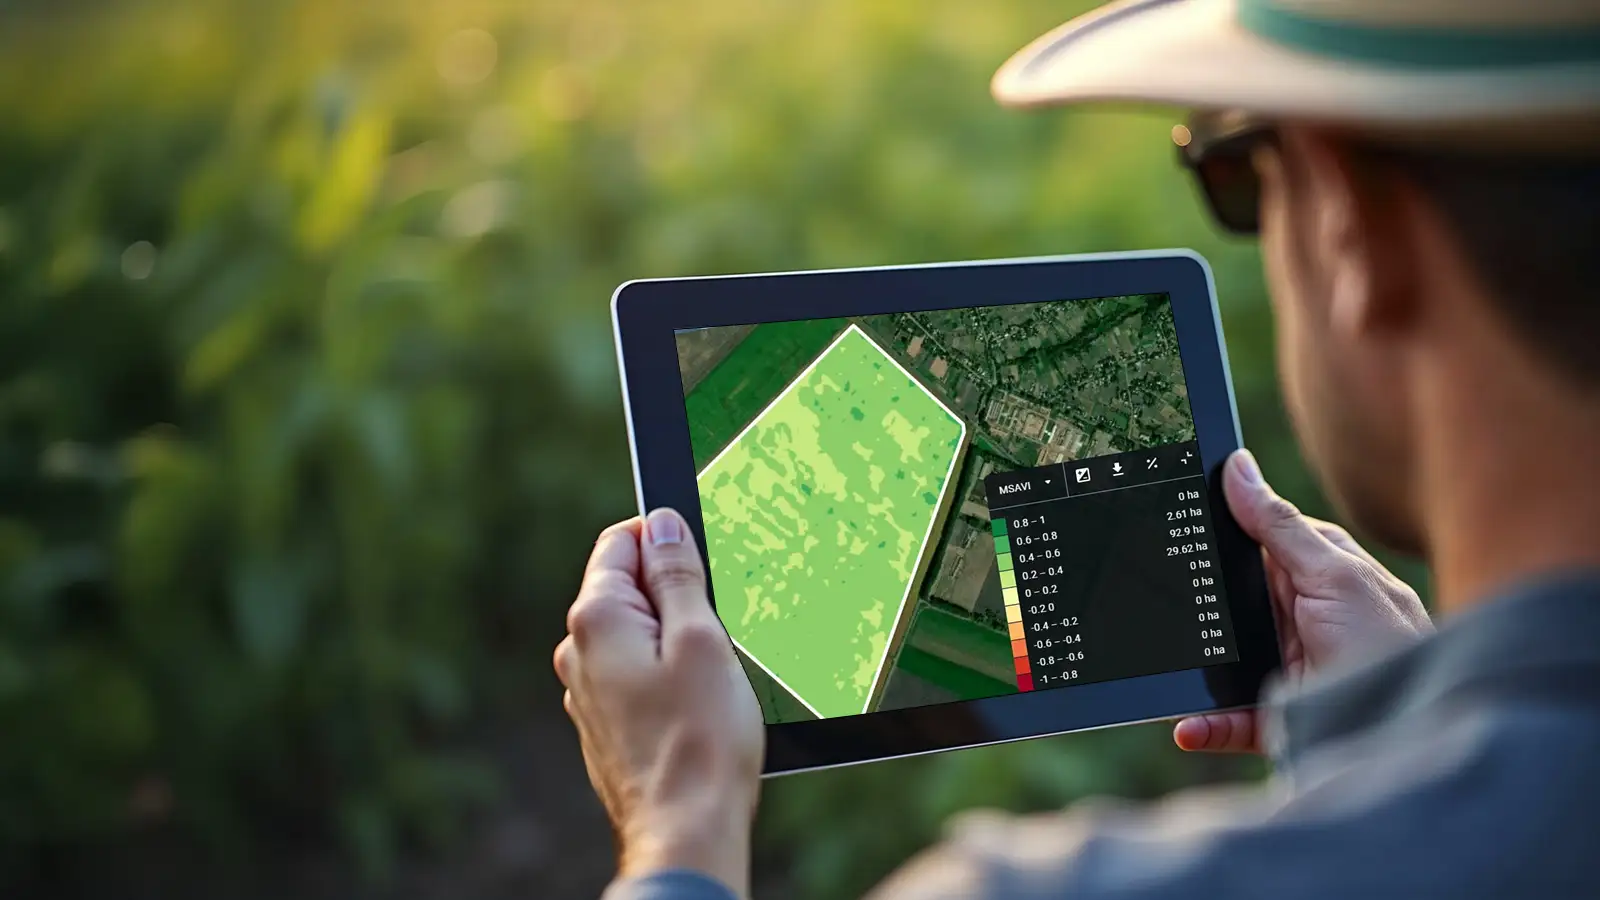
How are vegetation indices measured from space?
- Blue (450 nm-510 nm)
- Green (510 nm-580 nm)
- Red (630 nm-690 nm)
- Near-infrared (NIR) (770 nm-895 nm)
- Short wave infrared (SWIR) (1100 nm-3000 nm)
Several satellites provide vegetation indices data. The most common ones include Advanced Very High-Resolution Radiometer (AVHRR), Moderate-resolution Imaging Spectroradiometer (MODIS) Vegetation 1 and 2 sensors, Landsat series, Sentinel-2, WorldView, Planet. The best choice will depend on your specific needs. Some factors to consider are:
- Resolution: How much detail do you need?
- Coverage area: How large is the area of interest?
- Temporal resolution: How often do you need data updates?
- Cost: Is free data sufficient, or will you pay for higher resolution options?
Classification of vegetation indices
- Number of spectral bands involved (two or more)
- Calculation method (ratio-based or orthogonal)
- Evolutionary lineage (categorized as first or second-generation)
Using these classifications, one can select vegetation indices suitable to their objectives and analytical requirements.
The application of the vegetation index in agriculture
Agtech revolutionaries use the vegetation index actively in precision agriculture and optimize input usage while maximizing per-acre yield. Listed below are some uses of vegetation indices in agriculture:
- Precision Agriculture
- Classify vegetation
- Crop management
- Estimate the water content of soil remotely
- Schedule & manage crop irrigation
- Monitor evaporation and plant transpiration
- Detection and quantification of crop diseases
- Assess tillage
- Identify changes in biodiversity
- Future reference to mark periodic changes over time
Benefits of vegetation indices
- Remote intelligence: Provides valuable intelligence into Crop health.
- Data precision: Ensures accurate and reliable measurements of the status of your farmlands; gets data analytics in a preferred format
- Cost efficiency: It is more cost-effective as it reduces the need for physical field inspections.
- Miles-away control: Allows companies to monitor and manage farm operations remotely without disturbing field activities.
- Enable scale: It allows monitoring of large-scale field activities in a short time and can also be scaled quickly and efficiently.
- Constant Monitoring: Monitor fields continuously and provide access to different image sources in one place.
Examples of vegetation indices and how to calculate them
NDVI (normalized difference vegetation index)
Normalized Difference Vegetation Index (NDVI) is the most common of the indices used in remote sensing. Chlorophyll, the green pigment indicative of plant health, exhibits strong absorption of visible light, while the cellular components of leaves reflect near-infrared light prominently. When a plant experiences stress like dehydration or disease, its cellular structure alters, resulting in increased absorption of near-infrared light. So, monitoring the changes in near-infrared light relative to red light is a reliable method for assessing the presence of chlorophyll, which directly correlates with the overall health status of the plant. A dip in NDVI is a cause for concern, indicating deterioration in crop health.
Index range: The NDVI value ranges from -1 to +1.
| NDVI values | Indication |
|---|---|
| Negative values | Clouds, water, snow |
| Values close to zero | Rocks and bare soil |
| Very small values (0.1 or less) | Empty areas of rocks, sand, snow |
| Moderate values (0.2-0.3) | Shrubs and meadows |
| Higher values (0.6-0.8) | Temperate and tropical forests |
Normalized difference red edge index (NDRE)
Index range: The standard scale of NDRE value ranges from -1 to +1.
| NDRE values | Indication |
|---|---|
| -1 to 0.2 | Bare soil or developing crop |
| 0.2 to 0.6 | Unhealthy plant or crop not yet mature |
| 0.6 to 1 | Healthy, mature, ripening crops |
Vegetation health index (VHI)
Soil-adjusted vegetation index (SAVI)
| Value of L | Amount of green vegetation cover |
|---|---|
| 1 | No green vegetation cover |
| 0.5 | Moderate vegetation cover |
| 0 | High vegetation cover |
Index range: The range for SAVI is between 0 and 1
Enhanced vegetation index (EVI)
Index range: EVI clearly indicates vegetation health. The values range from -1 to 1. If EVI is closer to 1, the vegetation is healthier, while values nearing 0 suggest compromised plant health.
Leaf area Index (LAI)
Index range: LAI generally ranges from 0 to 10. Zero indicates bare ground, while 10 represents dense conifer forests.
Land surface water index (LSWI)
Index range: The values of this index range from -1 to +1. The common range for green vegetation is 0.2-0.6.
Applications: LSWI finds diverse applications, including monitoring crop irrigation, productivity forecasting, fire hazard assessment, and ecosystem physiology studies. Notably, this index operates inversely compared to other vegetation water indices. Higher LSWI values indicate heightened water stress and diminished water content.
NDWI (Normalized difference water index)
The Normalized Difference Water Index (NDWI) helps relate to the water content in plants, making it a good indicator of plant water stress. NDWI is the normalized difference between visible green (high reflectance of water surface) and near-infrared (high reflectance of soil and terrestrial vegetation) spectral bands. It can detect and monitor even marginal changes in the water content of the water bodies.
Index range: The NDWI values range between -1 to +1. For water bodies, NDVI is positive, typically above 0.5, while it is negative to zero for soil and terrestrial vegetation, making it easy to differentiate the two.
Tillage metric (sustainability)
Index range: The values range between -1 to +1
ChlRe – Chlorophyl red edge (for greenness – nitrogen)
- Diverse precision agriculture uses
- Identification of nutrient deficiencies in plants
- Nitrogen fertilizer uptake assessment
- Yield prediction
- Variable rate application prescription mapping