
Synopsis : Cropin has revolutionized agriculture with the launch of Cropin Sage, a groundbreaking generative AI-powered agri-intelligence platform built on Google’s Gemini. In this blog, we reveal how Cropin Sage, a platform that delivers comprehensive intelligence into the past, present, and future of cultivation, processes simple, natural language queries to provide answers in an easy-to-understand, actionable visual representation.
Cropin launched Cropin Sage, the world’s first generative AI (gen-AI)- powered agri-intelligence platform. This groundbreaking innovation, built on Google’s Gemini, marks a significant leap forward in enabling decision-making across the agriculture value chain. Cropin Sage is a powerful querying platform delivering agri-specific intelligence covering past, present, and future timeframes. It is custom-trained to solve for agriculture using geospatial and temporal datasets and evolves continuously with new datasets covering more crops, seasons, and regions.
Starting with natural language text queries from users, Cropin Sage extracts intent and provides answers to the queries in a contextual and easy-to-understand visual format.
Let’s learn how!
Gridification as a way of structuring large volumes of agricultural data
Managing vast volumes of structured and unstructured data is crucial for informed decision-making in the ever-evolving agricultural landscape. Cropin handles extensive agricultural and related datasets generated by Cropin AI Labs, deploying advanced data science models. These datasets, sourced from multiple open sources and global repositories, are structured and housed in Cloud SQL databases to facilitate effective management and utilization. A key technique employed for structuring this data is gridification.
Understanding gridification
Gridification is the process of converting large volumes of data into a grid format. This method classifies data into smaller, manageable grids based on specific geographical locations or other relevant parameters. Doing so allows us to systematically organize and analyze data with greater precision and efficiency.
Agricultural data in grids can vary in frequency, daily (temperature), monthly (soil moisture), and seasonal (crop acreage). Gridification involves associating data with specific grid cells, enhancing spatial analysis along with retaining the frequency of this data, enabling the user with spatial and temporal variations for precise decision-making.
Gridification of Data and Temporal Variations of Data in a Grid
Why gridification?
Enhanced Scalability, Precision, & Efficiency : Handling large datasets can be challenging and also inefficient. Gridification helps break down the data into smaller, more manageable chunks, making it easier to process and analyze. By focusing on specific locations, gridification allows for more accurate data analysis, which is essential for making informed decisions in agriculture. Structured data in grid format can be accessed and processed faster, leading to quicker access to insights and actions.
Improved Data Management and Enhanced Data Accessibility : Organizing data into a defined storage schema, with custom grid size to suit specific needs, ensures that each type of data is stored and managed according to its unique characteristics and frequency of updates. Furthermore, this gridified data can be accessed quickly and efficiently, allowing for real-time analysis and decision-making.
Data Integration for Accurate Insight Generation: Gridification facilitates the integration of diverse datasets with varying characteristics, like resolution, data type, frequency, etc., into a single platform, providing a comprehensive view of the agricultural landscape. The precision of this integrated massive web of gridified data leads to more granular and accurate intelligence, enabling governments, farmers, and agribusinesses to make better-informed decisions.
Our database is meticulously structured to include gridified agricultural, weather, satellite, and various other associated data for a specific location. This data is optimally organized into three distinct tables:
Static Data : Contains data that remains constant over extended periods, such as geolocation information, long-term climate normals, and global datasets with a refresh rate of 30 years.
Seasonal Data: Includes data that varies by season, providing critical intelligence and trends over the years.
Monthly Data : Comprises monthly variations, offering detailed and timely information to support accurate and up-to-date analysis.
This Schema can be expanded to include daily, weekly, and annual data refresh rates or data delivery intervals of different data types or formats.
All grid metadata is stored in Cloud SQL service, which can scale to support large data volumes, which is enabled by this expandable storage schema.
Accessing a wealth of data using natural language queries with Gen AI
Cropin Sage offers flexible and secure access! Subscribers can ask questions through user-friendly mobile apps, web UI, or REST APIs, while secure OAuth keeps unauthorized users out.
Cropin Sage deployed on Containerized Google Kubernetes Engine (GKE) Service streamlines the user experience. Powered by Google’s Gemini, Cropin Sage seamlessly translates natural language queries into SQL (Structured Query Language) statements. These are then executed on the Cloud SQL DB, which houses a rich repository of agri and other auxiliary data.
This integration enables users to interact with and visualize data effortlessly without requiring expertise in SQL syntax. By bridging the gap between complex data and user-friendly access, Cropin Sage empowers stakeholders to make data-driven decisions with ease.
For example, a user interested in understanding the average yield trends in a particular region can simply ask, “What is the average yield for Potato in Idaho over the past, current, and next season?” Cropin Sage processes this natural language query, converts it into an SQL statement, and retrieves the relevant data. The results are then displayed on a grid-based map, complemented by trend analysis visualizations, providing the user with clear insights to act upon within seconds.
This ‘Simple Text to SQL’ Engine is fueled by an extensive and sophisticated prompt with a detailed explanation of DB, schema, and metadata, along with ideal scenarios that the model now uses as a framework to generate the outcomes. Though the model may misinterpret due to ambiguity in some text queries, the highly intricate and evolving technology now paves the way for a state-of-the-art global agri-data repository with an immediate analysis and custom reporting tool.
Custom report generation within seconds ahead
Cropin Sage breaks down language barriers! Regardless of your preferred language among the 40+ supported by Google’s Gemini, you’ll receive a response within 4-5 seconds, thanks to efficient post-processing. The report consists of three core pieces of information represented on the user interface:
1. Grid visualization:
- The grid can be visualized from the region of interest on the leaflet map.
- Metadata is accessible as tooltip information upon hovering over the grid.
- This information is categorized, with a unique color assigned to each bucket.
- Four buckets are created by default based on the minimum and maximum value ranges of the requested data.
2. Data trends:
- Trends of the requested data across the region of interest are visualized.
- Three trends are displayed in this section:
- Count of grids within each bucket.
- Trend of acreage estimation across multiple years.
- Trend of average yield across multiple years.
3. Detailed weather reports:
- Detailed daily temperature and precipitation data can be visualized upon clicking a grid.
Data to decisions to dashboard: A comprehensive architecture
This architecture diagram illustrates a streamlined process from querying data to generating actionable intelligence on a dashboard.
Here’s a simplified explanation:
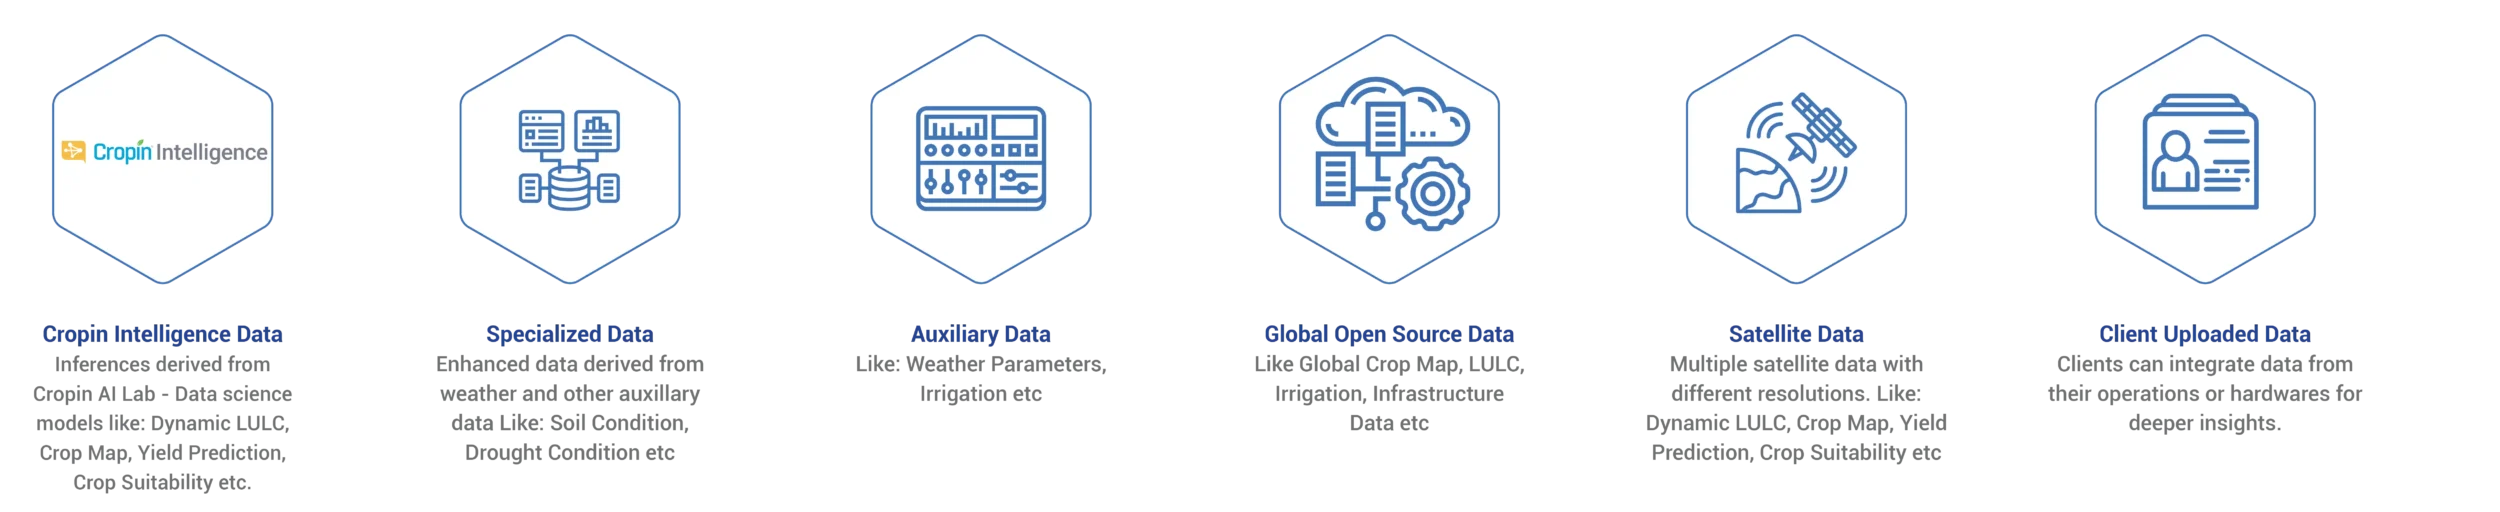
1. Data collection:
- A complex array of structured and unstructured data including multi-layered global weather data, earth observation data, Cropin intelligence data layers, open source public datasets, existing datasets integrated by clients like pricing data, etc., are collected.
- The data collected is gridified.
- The data is stored in a Cloud SQL Database (DB) from Cropin agri data stack and is categorized into three types: Static Data, Seasonal Data, and Monthly Data.
2. User query:
- Users can make queries in natural language.
- The query is processed using a Language Model (e.g., Google Gemini Pro), which converts it into an SQL query to fetch the relevant data from the database.
3. Data processing:
- The SQL query retrieves the required data from the Cloud SQL DB.
- Post-processing is performed to generate an API response.
4. Data representation:
- The processed information is represented on the User Interface (UI) in several ways:
- Grid Visualization: The data is displayed on a leaflet map with metadata accessible via tooltips.
- Data Trends: Trends over multiple years are shown.
- Detailed Weather Reports: Detailed daily weather data can be accessed by clicking on specific grids.
5. Actionable intelligence:
Users can extract actionable intelligence from the visualized data within seconds, aiding decision-making processes.
In summary, this architecture efficiently converts user queries into detailed, actionable data representations through a series of processing steps, ultimately displayed on an intuitive and dynamic dashboard.
Cropin Sage detailed architecture: from query to intelligence
Scenario 1: Static information query
If you are looking for the ideal location to grow potatoes in Bonneville County, Idaho. Simply ask Cropin Sage, “Show me the most suitable grids for potato crops in Bonneville County, Idaho.” To depict crop suitability data, which is static information, the core information needed is the ‘boundary’ information. In this case, you have requested data for Bonneville County in Idaho, which falls within the subscribed region. The platform identifies and displays relevant grids on the map view for deeper analysis, along with associated statistics and reports, allowing easy visualization, as shown in Figure 1.
Scenario 2: Seasonal crop information query
Suppose you query, “Show me grids with an average yield above 30 tonnes per hectare in 2024 in Bingham.” This query is mapped to Seasonal Data in the Storage Schema and requires three key pieces of information to surface the requested data: Crop Name, Year, and Boundary. The default Crop Name is ‘Potato,’ the same as the subscribed crop for the requested Region/Boundary, i.e., Bingham County in Idaho (Refer Figure 2).
Upon mapping with the correct data, post-processing begins, wherein the ‘average yield’ is bucketed into four categories. The minimum value is set at 30, as requested. If the maximum value is not specified in the query, the highest value attained by any grid in the region of interest is considered. Designated colors are assigned to the buckets. The grids can then be visualized on the map view with the required trend and the weather report.
Scenario 3: High-frequency information query (like adverse weather conditions etc)
If you want to understand adverse temperature conditions, query, “Show me boundaries with high temperature and low precipitation, which has a high crop area as of September 2023.” This query is mapped to High Temporal Frequency Information in the Storage Schema and requires four key pieces of information to surface the requested data: Boundary, Crop Name, Year, and Month.
In this case, the grids requested should fulfill the criteria of ‘high temperature,’ ‘low precipitation,’ and ‘high crop acreage estimation.’ This mapping enables a comprehensive analysis of adverse weather conditions and their impact on the crop in 2023. Additionally, it provides intelligence into the potential impact of 2024 by reflecting yield predictions for the upcoming year.
We know weather conditions directly impact rainfed crops and indirectly impact irrigated crops. We can dive deeper into detailed weather reports by clicking on the grid to understand the daily variations of temperature and precipitation, along with the number of dry spells and wet and dry days in a month.
Complex decisions, simplified: How Cropin Sage empowers agri business professionals
As an agronomist in an agri-input enterprise, Risk analyst in an agri-lending division, or Procurement Strategist in an FMCG with a global presence, you are tasked with complex responsibilities like Causal Analysis, Comparative Analysis, Risk Assessment, Resource Planning, and Procurement Planning. These require navigating vast amounts of diverse data—historical, current, and forecasted. This data, encompassing global parameters with varying attributes, can be overwhelming.
Cropin Sage transforms this complexity into a matter of seconds.
This powerful platform empowers you to:
1. Minimize Risk and Environmental Impact : Helps geo-locate low-risk pest infestation clusters, enabling you to minimize chemical usage and contamination and preserve ecosystem health.
2. Reduce Crop Loss : Proactively identify regions with adverse weather conditions in high-crop yield regions. Issue a high-alert warning to the associated stakeholders to minimize impact.
3. Improve Risk Management : Develop proactive risk management strategies based on weather impact assessments, leading to decreased loan default rates.
4. Enhance Market Penetration : Gain a real-time edge by comparing current conditions with Long-Term Normals and Neighboring Regions for higher market penetration. This allows you to align with regional agricultural trends.
5. Make Accurate Demand Forecasts: Leverage market intelligence derived from comprehensive agricultural data to predict demand with improved accuracy.
Quantifying the AI impact of Cropin Sage
- Report Generation : Gone are the days of waiting weeks for custom reports. Cropin Sage delivers results in seconds, slashing turnaround time by a staggering 99.5%.
- Strategic Planning : Develop and refine strategies in a fraction of the time. Cropin Sage reduces strategy development from 3-4 weeks to just one day, representing a 96.7% time savings.
- Mitigating Risk :Identify high risks and pinpoint the time, geolocation, and crucial factors with improved accuracy. This enables in-depth causal analysis and impact assessment, ultimately enhancing risk mitigation strategies.
- Democratizing Data-driven Decision Making : The intuitive interface promotes widespread adoption of the platform across the organization. This could translate to faster, more accurate decision-making backed by readily available data.
Cropin Sage: Global reach, scalable intelligence
Cropin Sage empowers enterprise customers to deploy the platform across diverse geographic locations, unlocking valuable intelligence into critical agricultural data. Initially focused on 13 key crops like wheat, rice, potato, and maize (representing nearly 80% of global food demand), Cropin Sage delivers immediate impact on staple food production worldwide. Recognizing the evolving needs of our global enterprise clients, we continuously train the model to align with customer needs and market demand, covering more crops and countries.
The future of agri-intelligence is here
Cropin Sage represents a paradigm shift in the way we approach agricultural decision-making. By harnessing the power of generative AI, Cropin Sage empowers stakeholders across the agribusiness landscape to navigate complex challenges with unprecedented speed and accuracy. From minimizing environmental impact to mitigating risk and maximizing yield potential or identifying alternate sourcing regions, Cropin Sage equips you with the required intelligence to navigate the ever-evolving agricultural landscape confidently.
We invite you to explore our platform further. Connect with your Cropin Customer Success Manager today and unlock the benefits of Cropin Sage platform.