


Crop Identification & Crop Acreage Estimation
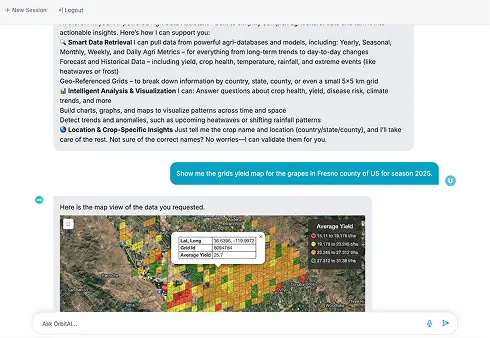
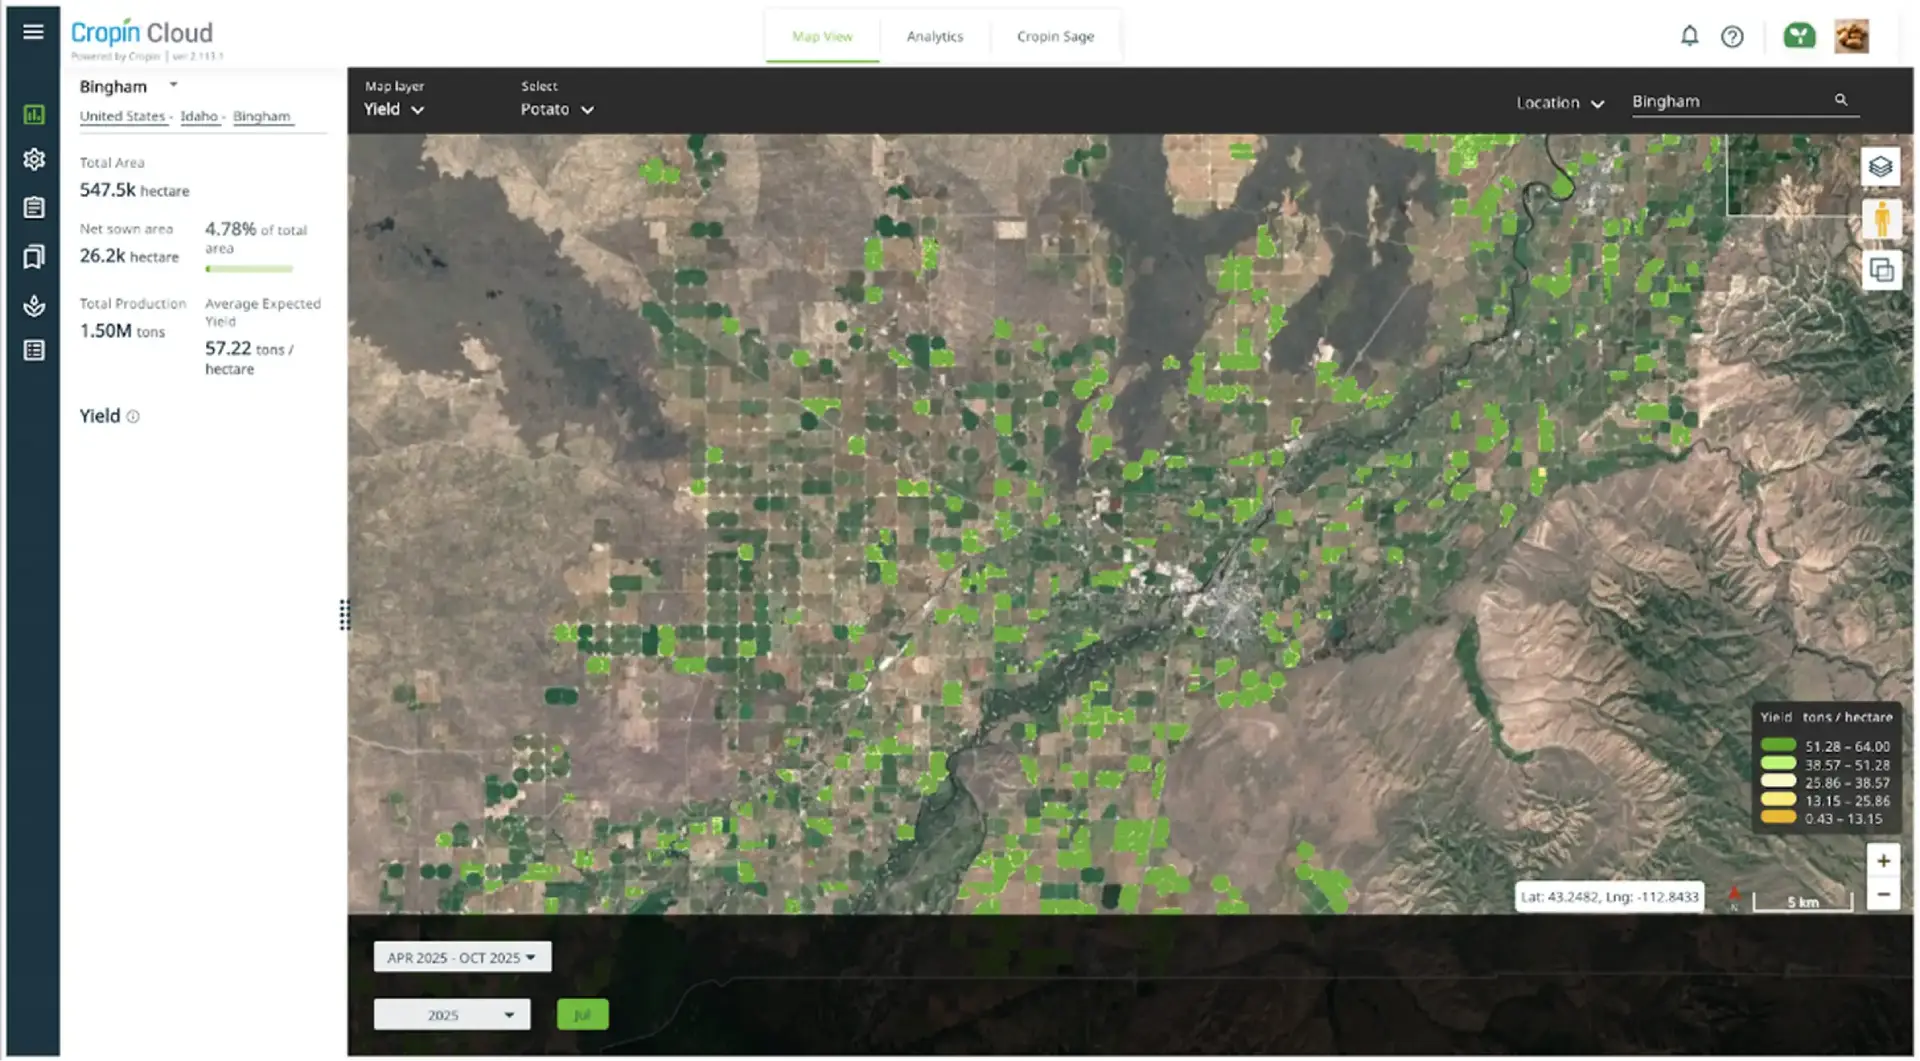
Crop Yield Estimation
Weather-based agronomic impacts by region and crop stage
Weather Anomaly
LULC – Dynamic agricultural land mask
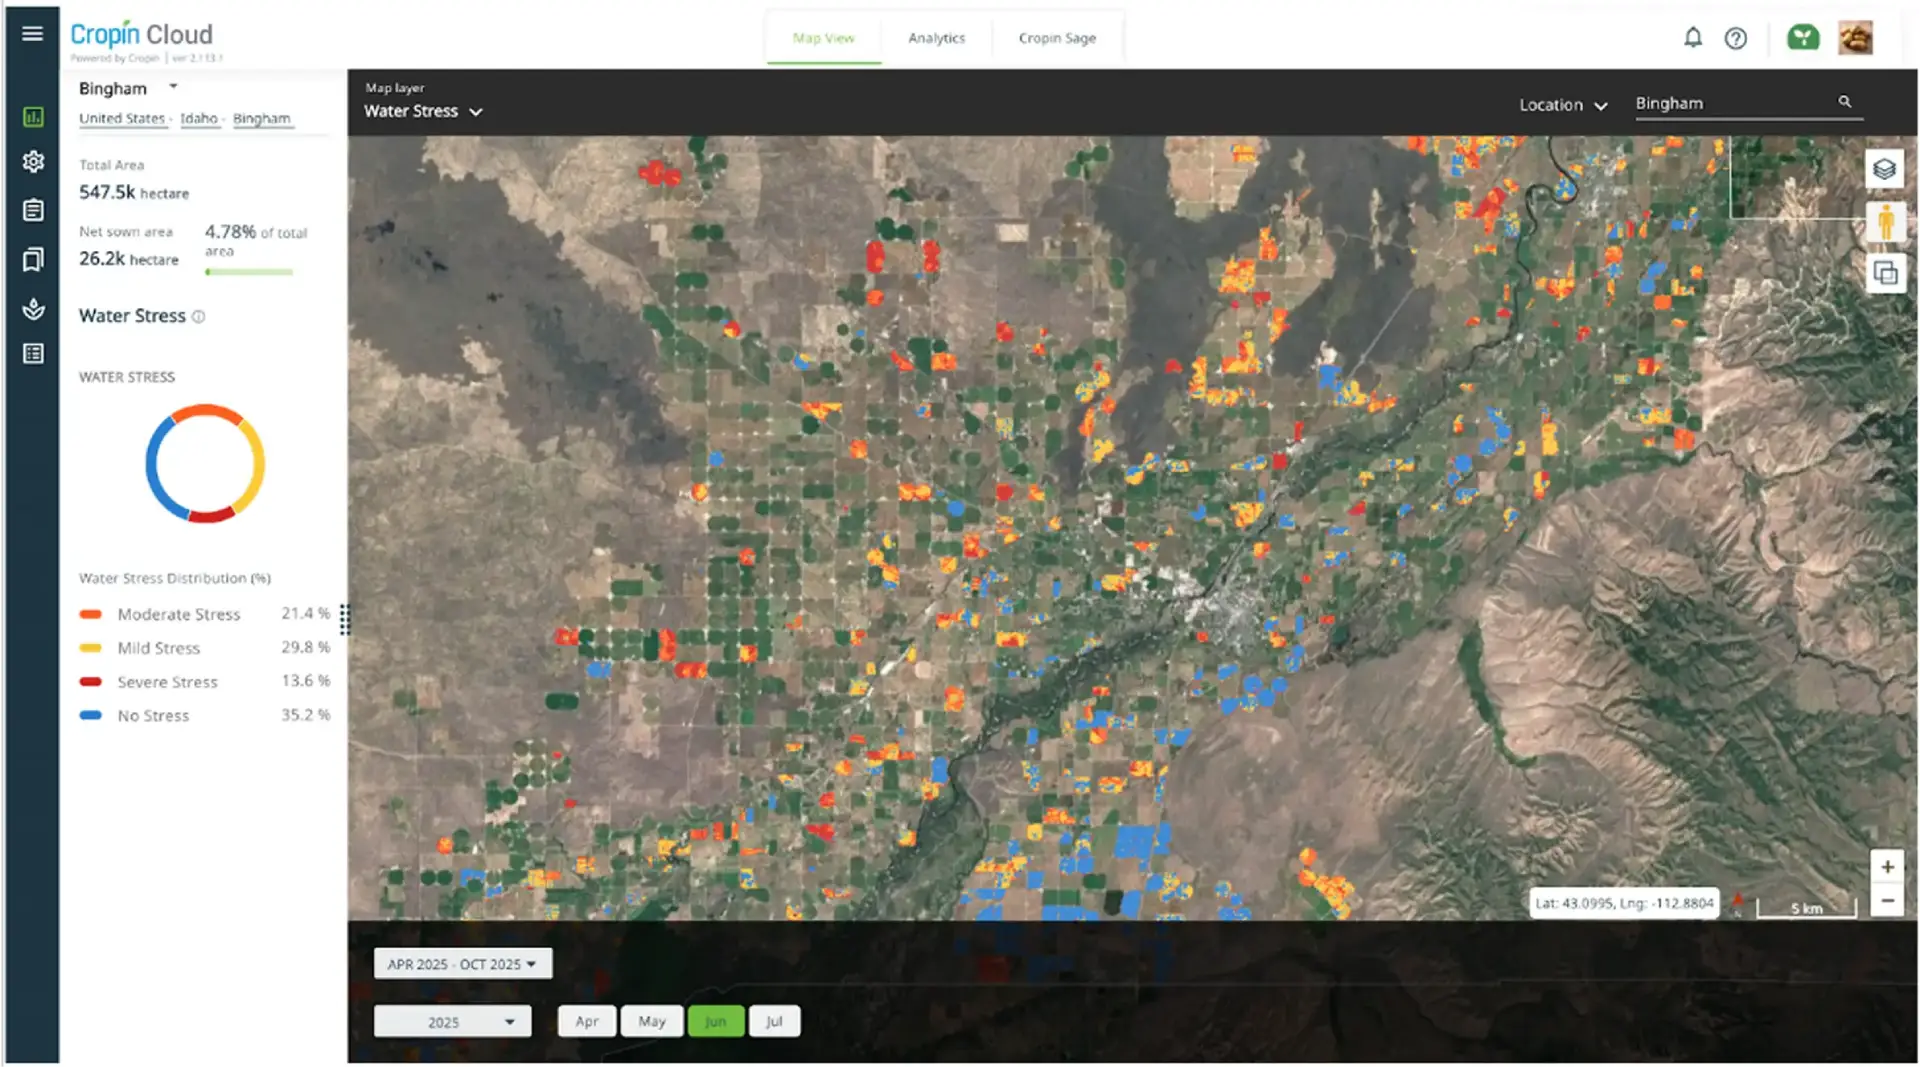
Water Stress
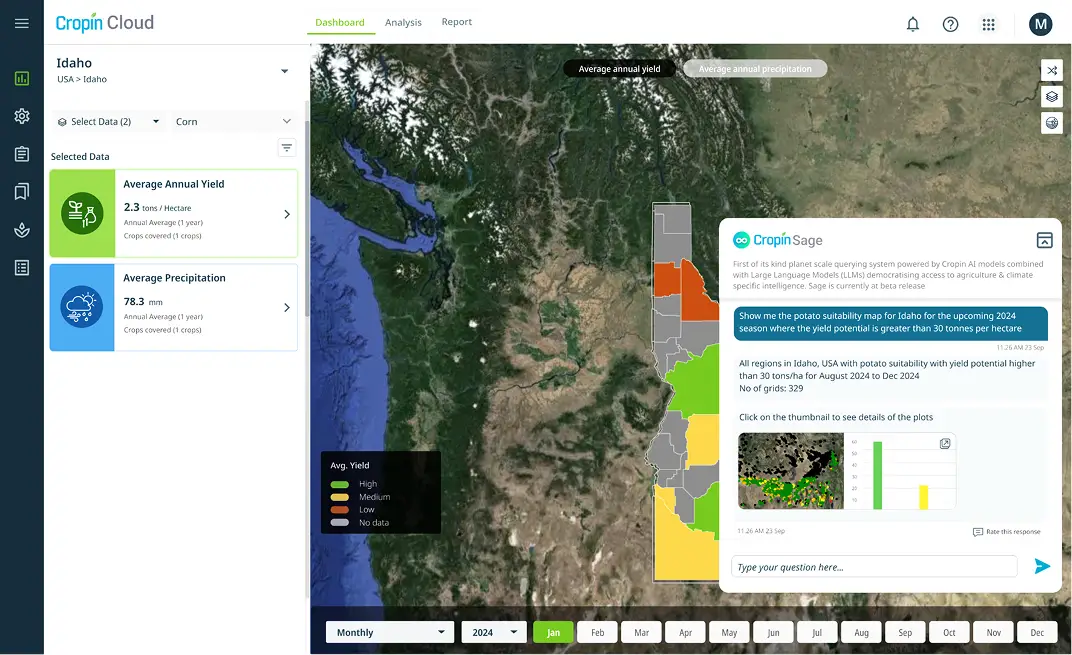
Potential Yield
Crop Suitability
Smart In-Season Sowing Window Insights
Harvest Window Forecast
Accurate Harvest Production Forecasts
Crop Age Detection
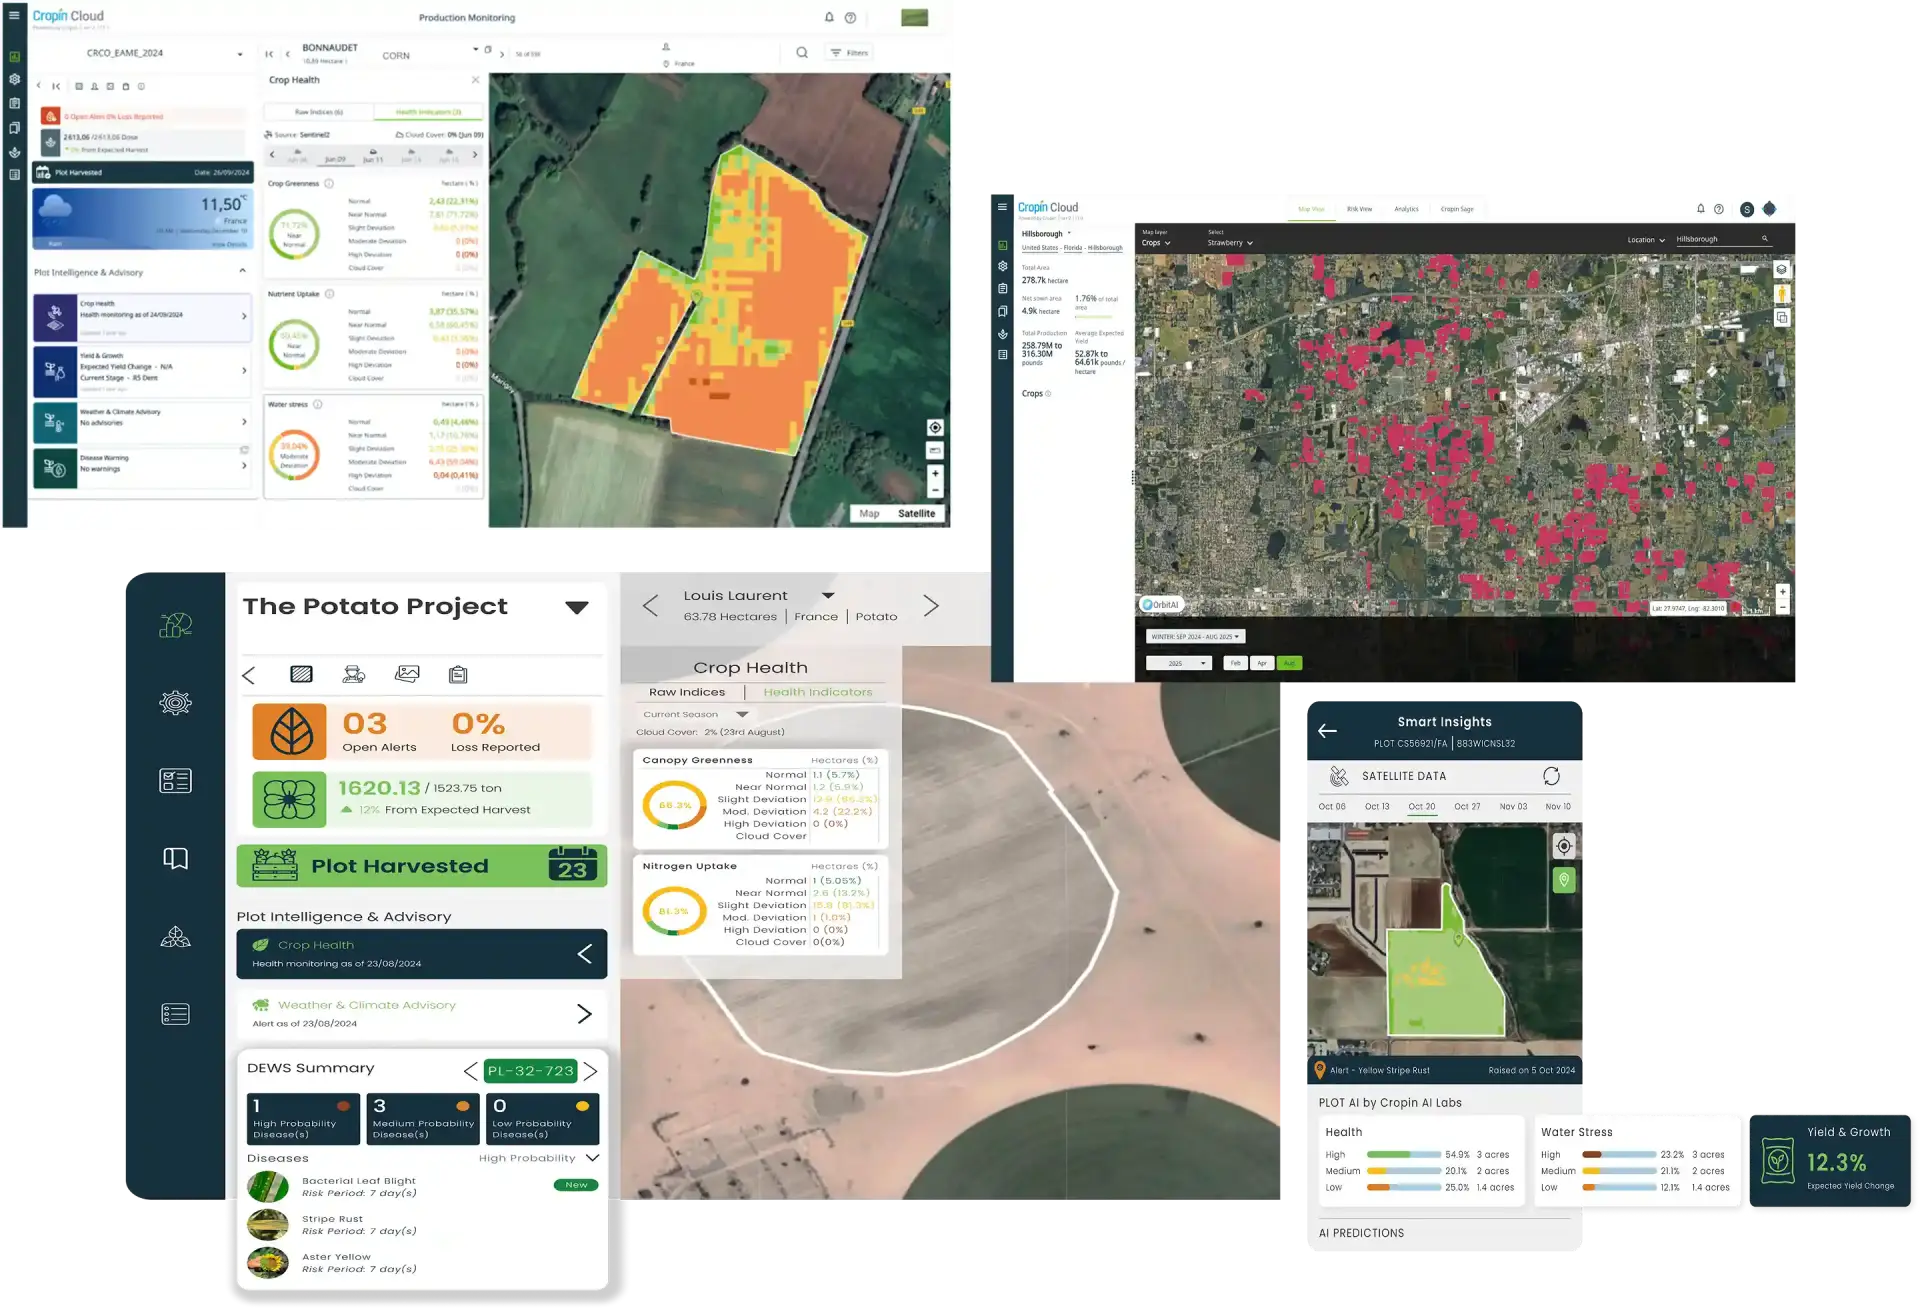
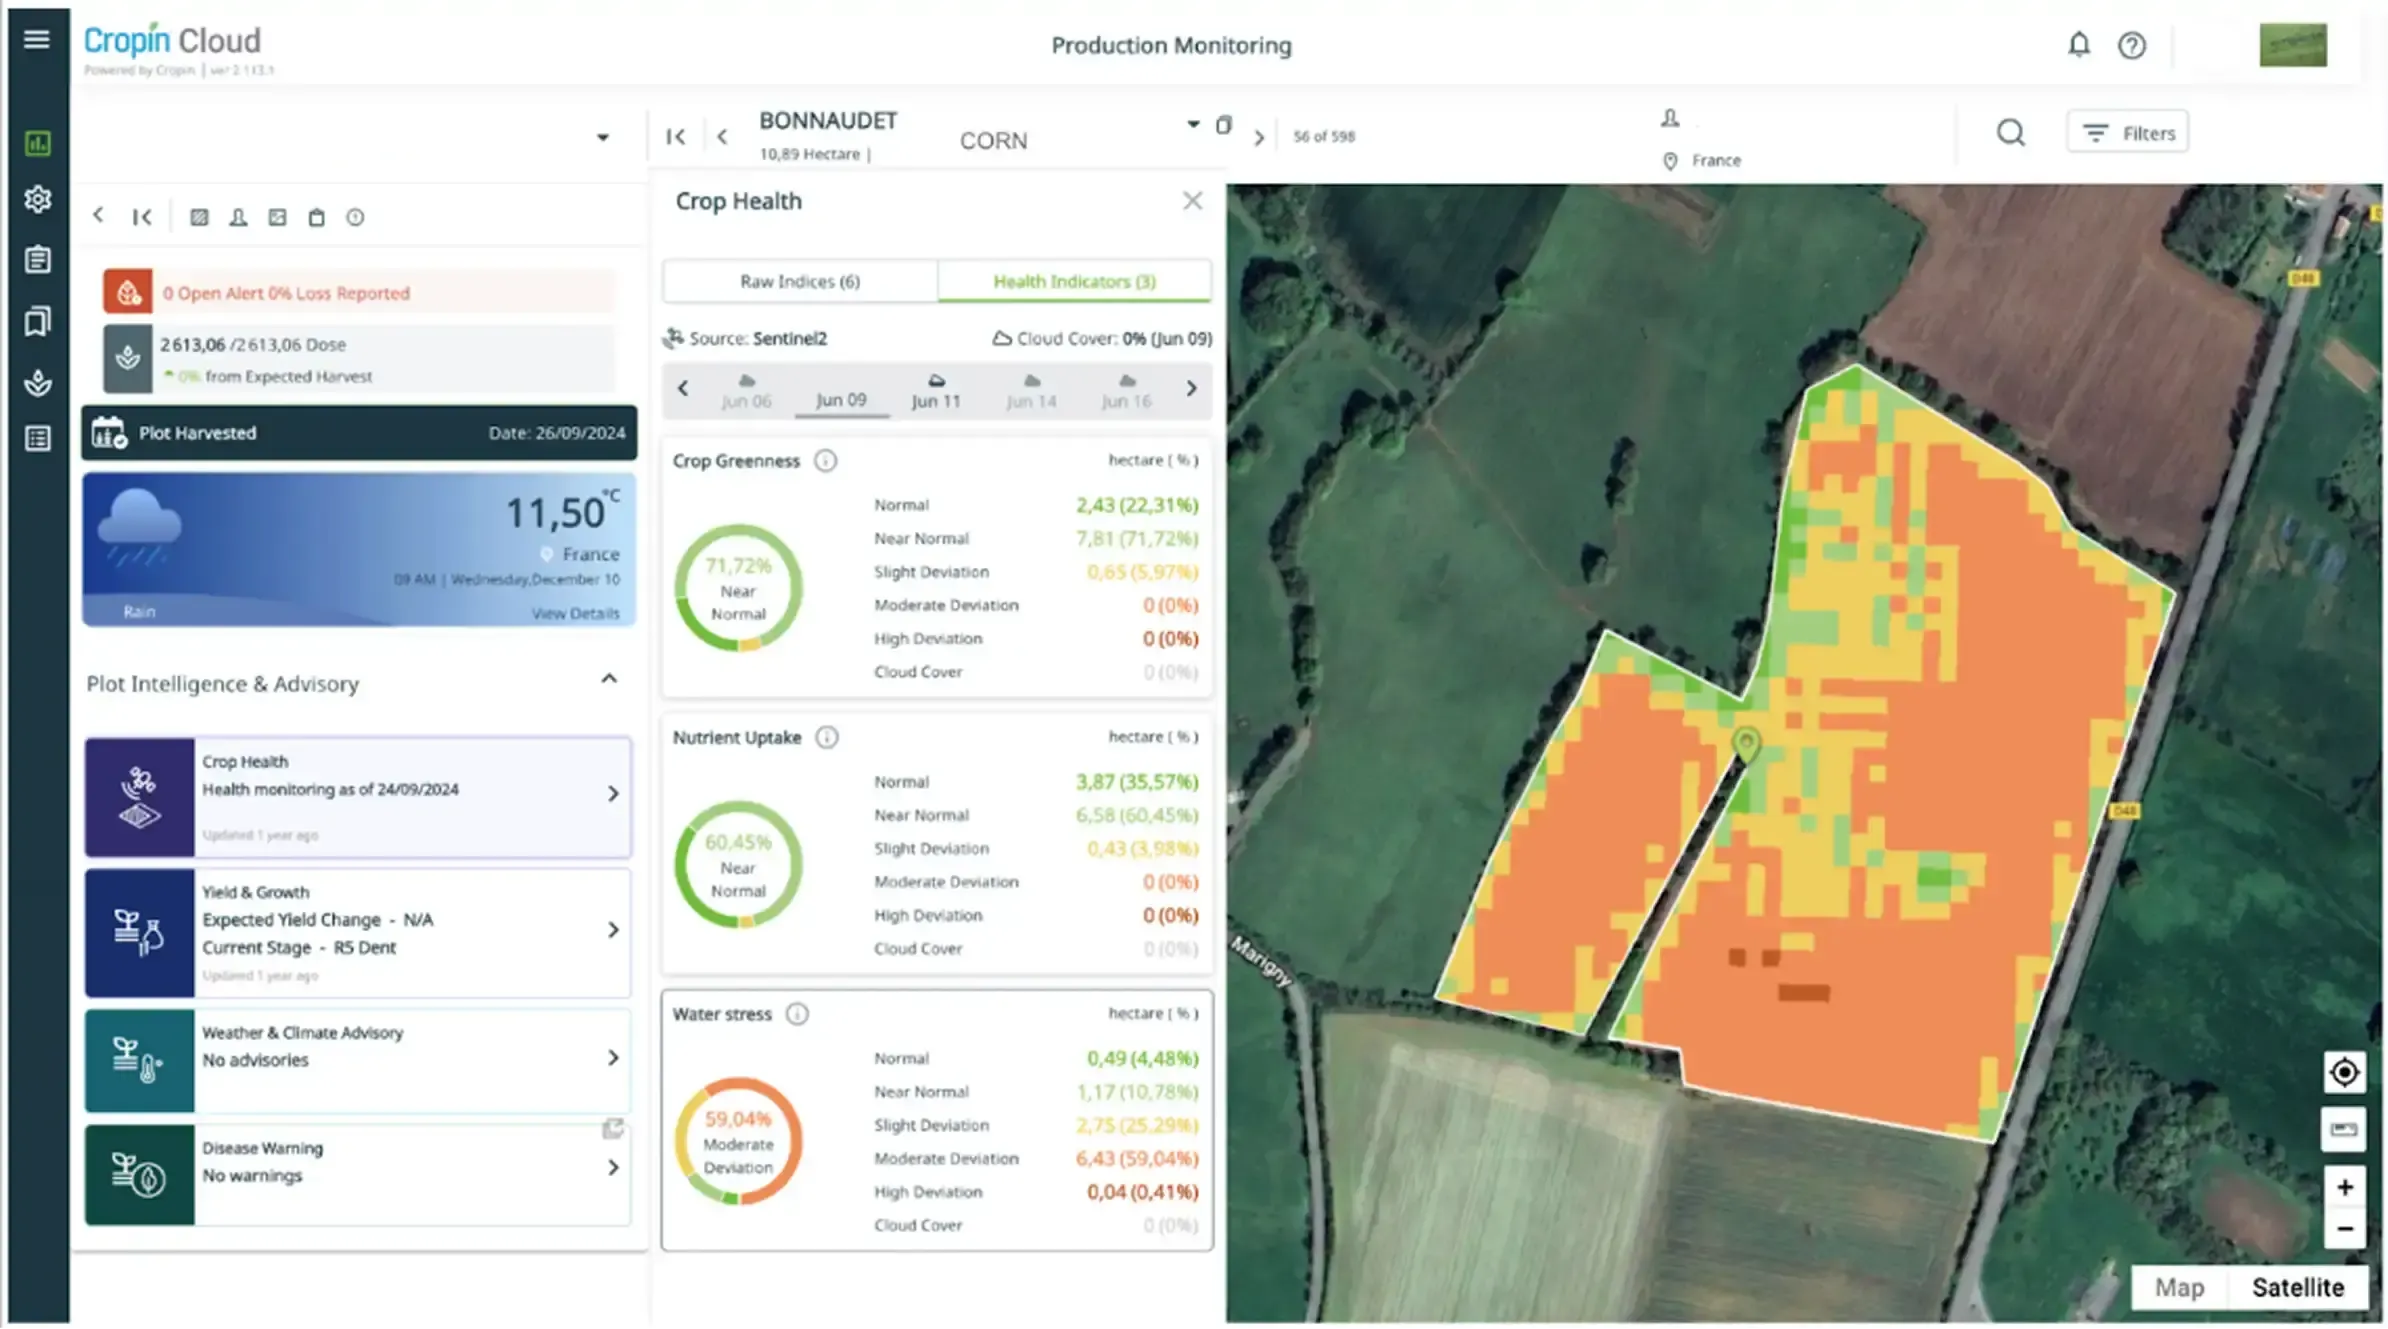
Crop Health
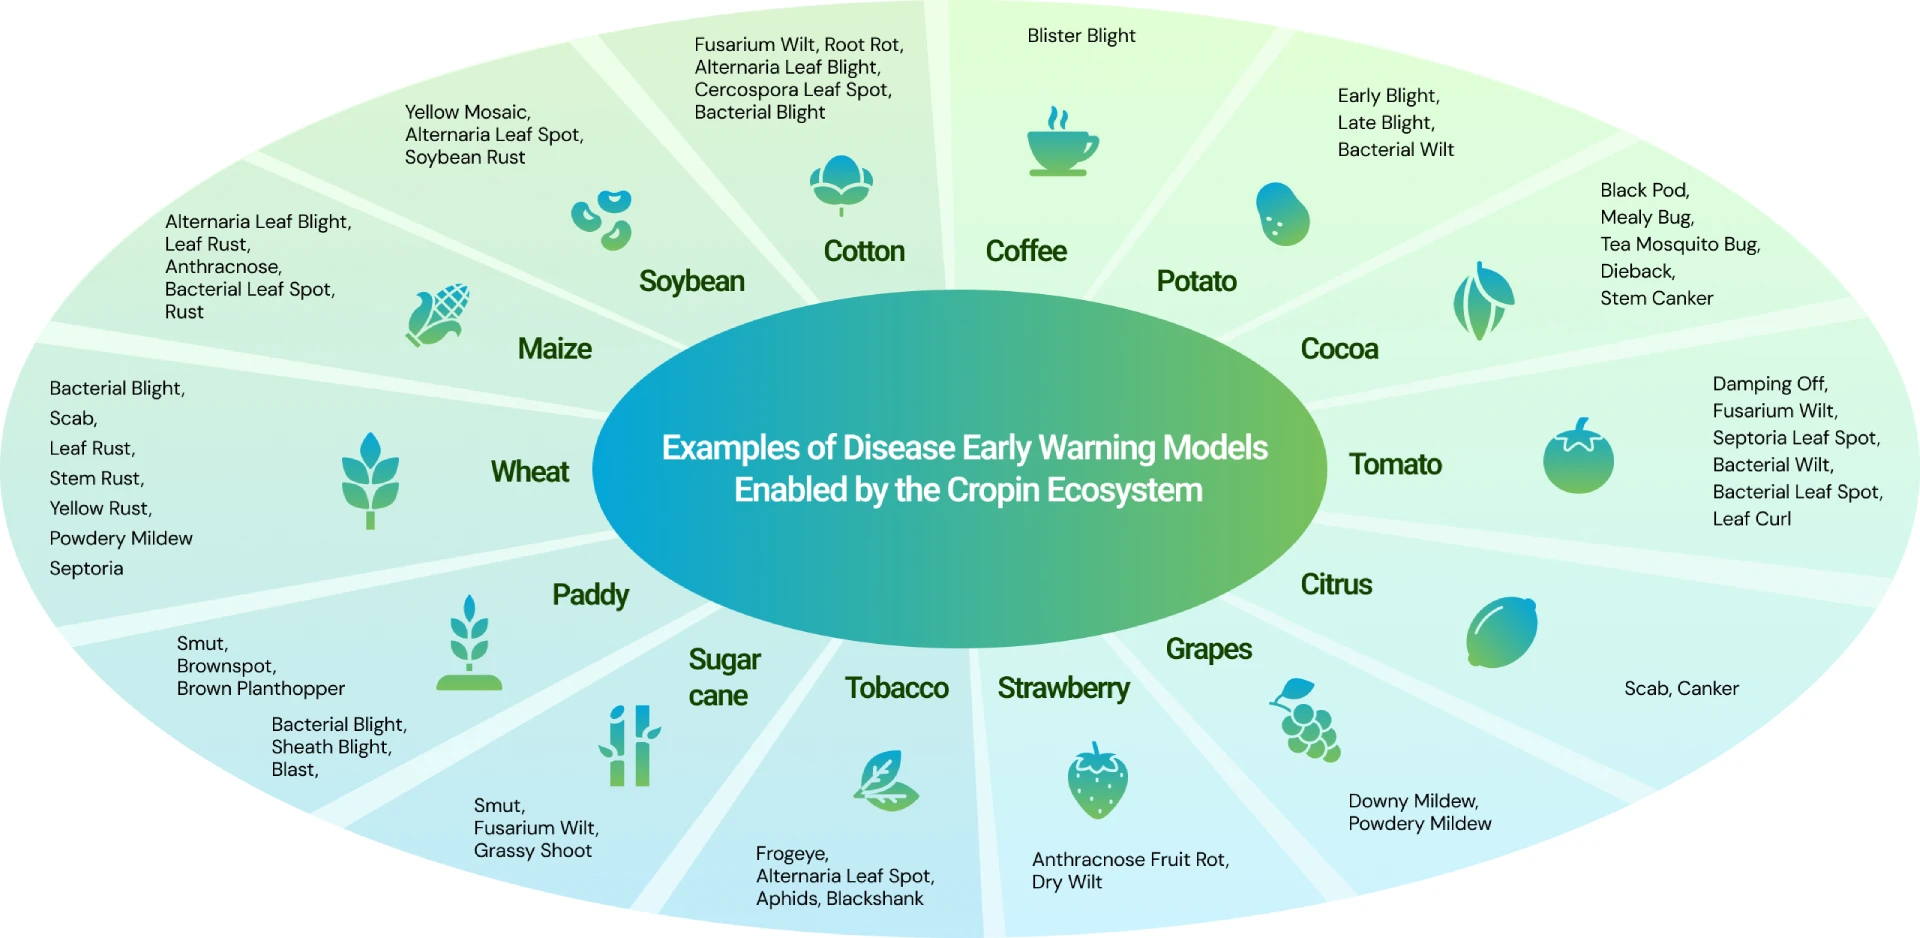
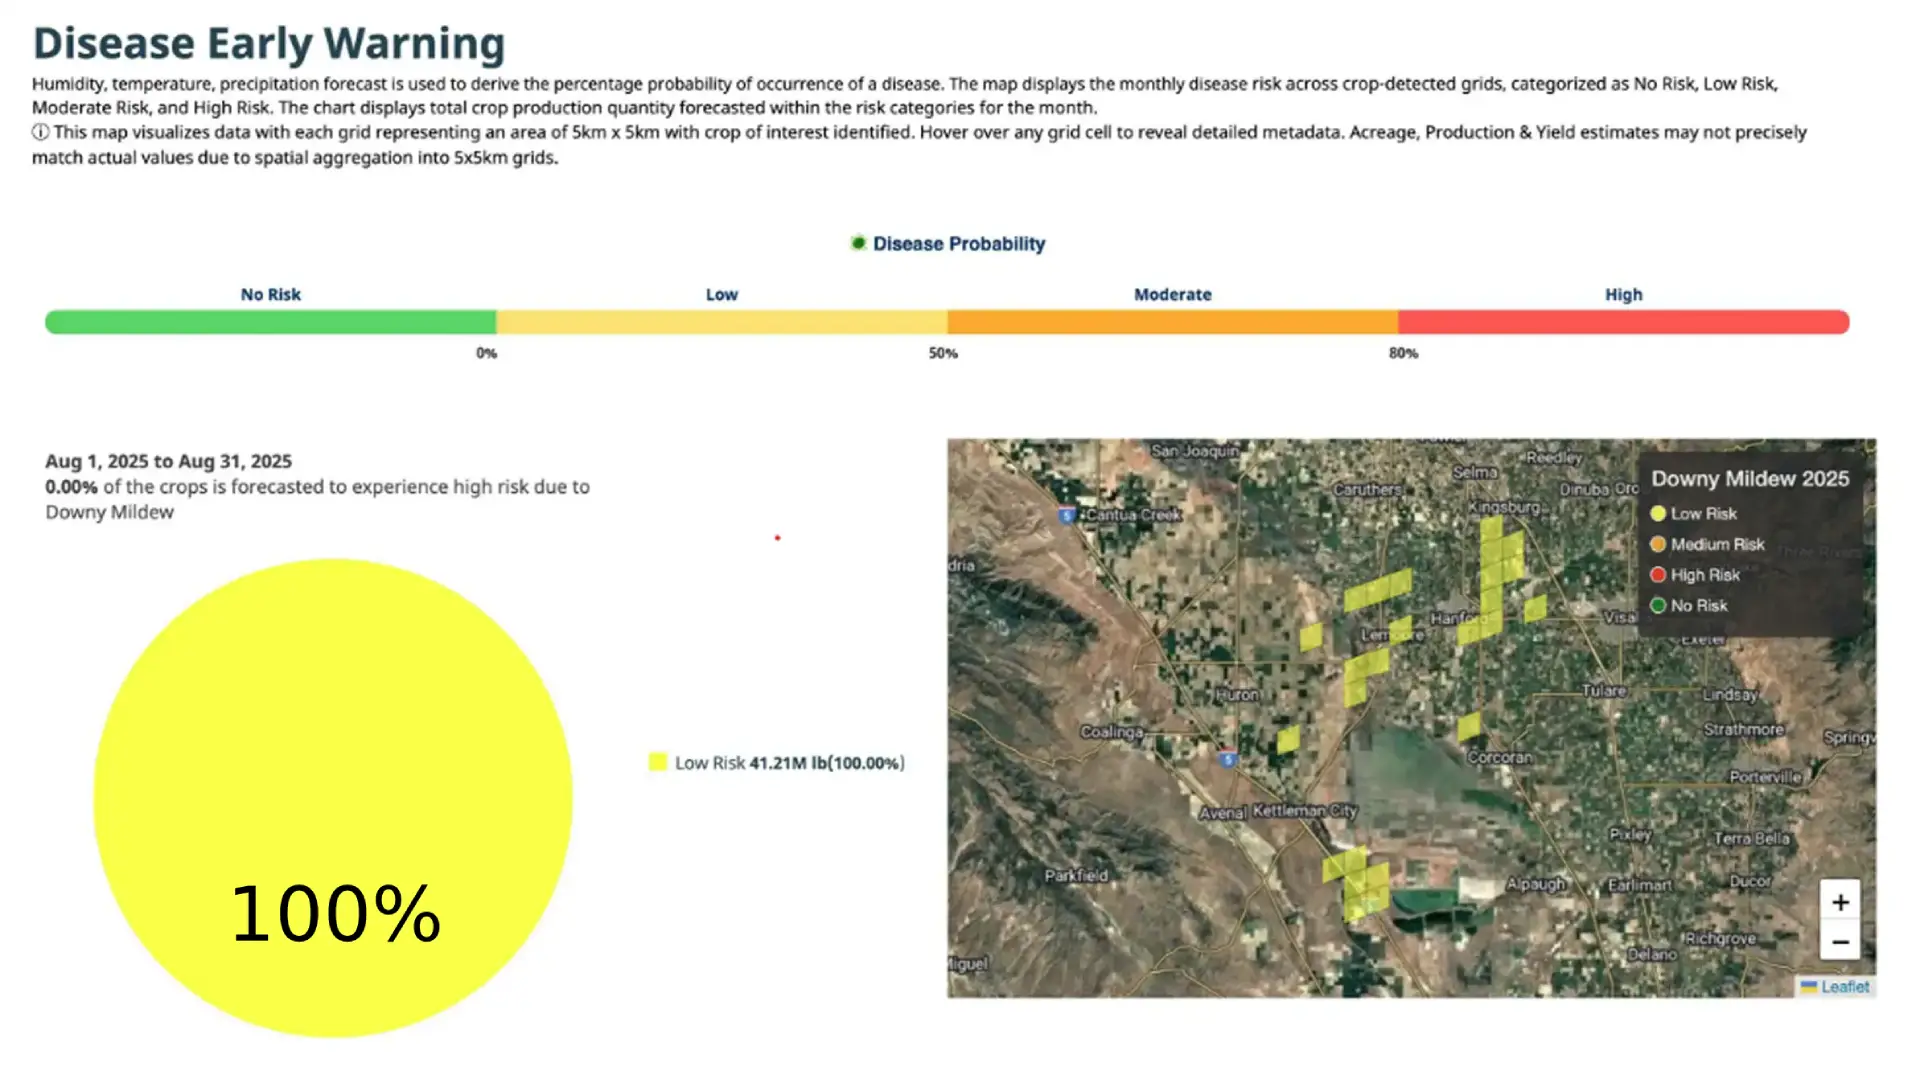
Disease Early Warning System
Identification of crops grown across a region or cluster, along with accurate detection of total sown area (ha) for each season.
Seasonal yield estimation for crops at a regional scale
Risk categorization based on region- and crop-stage-specific thresholds
Weather and soil anomalies (temp, rain, moisture, SPEI) vs long-term averages
A dynamic indicator that shows active crop or sowing areas, helping clearly distinguish agri land from non-agri land.
Indicates water stress (No, Mild, Medium, High) by comparing crop water needs with available water.
Potential yield shows the best possible harvest using past and forecast weather plus soil and crop data, and it identifies the ideal planting date and crop cycle.
Assessing crop suitability by evaluating elevation, soil, rainfall, temperature, humidity, sunlight, wind speed, and other conditions to categorize regions into suitability levels.
Bi-Weekly Tracking of Sown Area (ha) in the Target Region
Indicates if harvest timing is early, late, or normal vs. the typical window.
Expected weekly harvest production, measured in Metric Tonne (MT), for the season.
Detecting the Age of Standing Multi-Year Crops
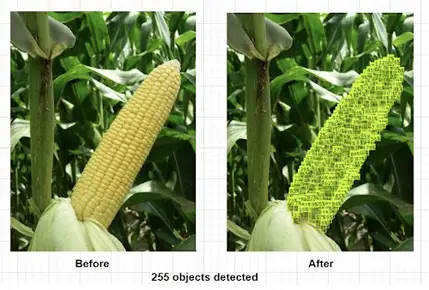
Identifying Crop Health Across an LGA Using Greenness and Vegetation Indicators
Identifying the likelihood of disease occurrence based on weather conditions
Seasonal coverage from sowing to any point post-maturity.
Seasonal coverage from sowing to any point post-maturity.
Temperature: Daily
Precipitation: Weekly
Heat Wave: Weekly
Drought: Monthly
DEWS: Monthly
Monthly
Season start to post-germination
Seasonal
Seasonal: start to end of season
Seasonal: start to end of season
Bi-weekly (Start of season to end of sowing)
Seasonal: start of season to post-maturity.
Weekly (post-maturity to harvest close)
Seasonal
Seasonal (from start of season to any point after germination)
Weekly
Monthly
Seasonal
Past - Current
Past - Current
Past - Current - Forecast
Past - Current - Forecast (Except soil moisture)
Past - Current
Seasonal
Forecast
Forecast
Past - Current
Past - Current - Forecast
Past - Current - Forecast
Past - Current
Past - Current
Past - Current - Forecast