Stop Reacting to Crop Disease. Start Predicting It — with Cropin DEWS

Stop Reacting to Crop Disease. Start Predicting It — with Cropin DEWS Stop Reacting to Crop Disease. Start Predicting It — with Cropin DEWS

Table of contents

Synopsis:

By shifting the agricultural paradigm from reactive crisis management to predictive safeguarding, Cropin DEWS solves the industry’s critical “symptom lag” problem by forecasting crop disease risks weeks before visible infection occurs. The platform leverages a deep-learning hybrid model that simultaneously processes over 40 meteorological features and agronomic indicators to deliver hyper-local, plot-level probability scores. This blog uncovers how this forward-looking risk intelligence seamlessly integrates with frontline field workflows, enabling agribusinesses to protect yields, cut input costs, and build climate-smart supply chain resilience.
By the time a field team spots the first visible lesion on a leaf, the damage has already begun. Favorable conditions have persisted for days, pathogens have spread, and the window for low-cost, high-efficacy intervention has already narrowed. What follows is a costly scramble: reactive spraying, emergency field visits, and yield losses that are often difficult to recover.
This is the defining challenge of disease management in agriculture, and it has a name: the symptom lag problem. This is precisely the problem that Cropin’s Disease Early Warning System (DEWS) is engineered to solve. DEWS is a forward-looking risk intelligence model that provides probabilistic alerts ahead of visible infection, enabling teams to act earlier, plan better, and prevent losses before they escalate.

Why is crop disease a bigger problem today?

Every year, plant diseases and pests decimate an estimated 40% of global crop production, transforming a localized environmental issue into a systemic threat to global food security and economic stability. This burden is growing heavier as our climate shifts.
Recent El Niño cycles have triggered record-breaking temperature spikes and erratic rainfall patterns across the globe. These “heat anomalies” do more than stress the plant; they accelerate the metabolic rates of pathogens and broaden the geographical range where diseases can thrive. In West Africa, periods of heavy rainfall followed by drought have increased the incidence of fungal diseases such as black pod. In Asia and parts of Africa, disruptions to planting cycles have weakened crop resilience, making them more susceptible to infection.
Simultaneously, higher temperatures and humidity variability are accelerating disease life cycles and expanding their geographical reach. The physiological “comfort zone” for many high-impact fungi and bacteria is expanding, leading to disease outbreaks in regions and at times where they were previously unknown. As a result, disease patterns are becoming more frequent, less predictable, and more expensive to manage.
The fundamental lesson of modern agronomy is clear: once a disease manifests visibly, it is nearly impossible to compensate for the lost physiological potential with extra irrigation or fertilization. Prevention is the only viable path to resilience; the focus is on anticipating risks early and acting before damage spreads.

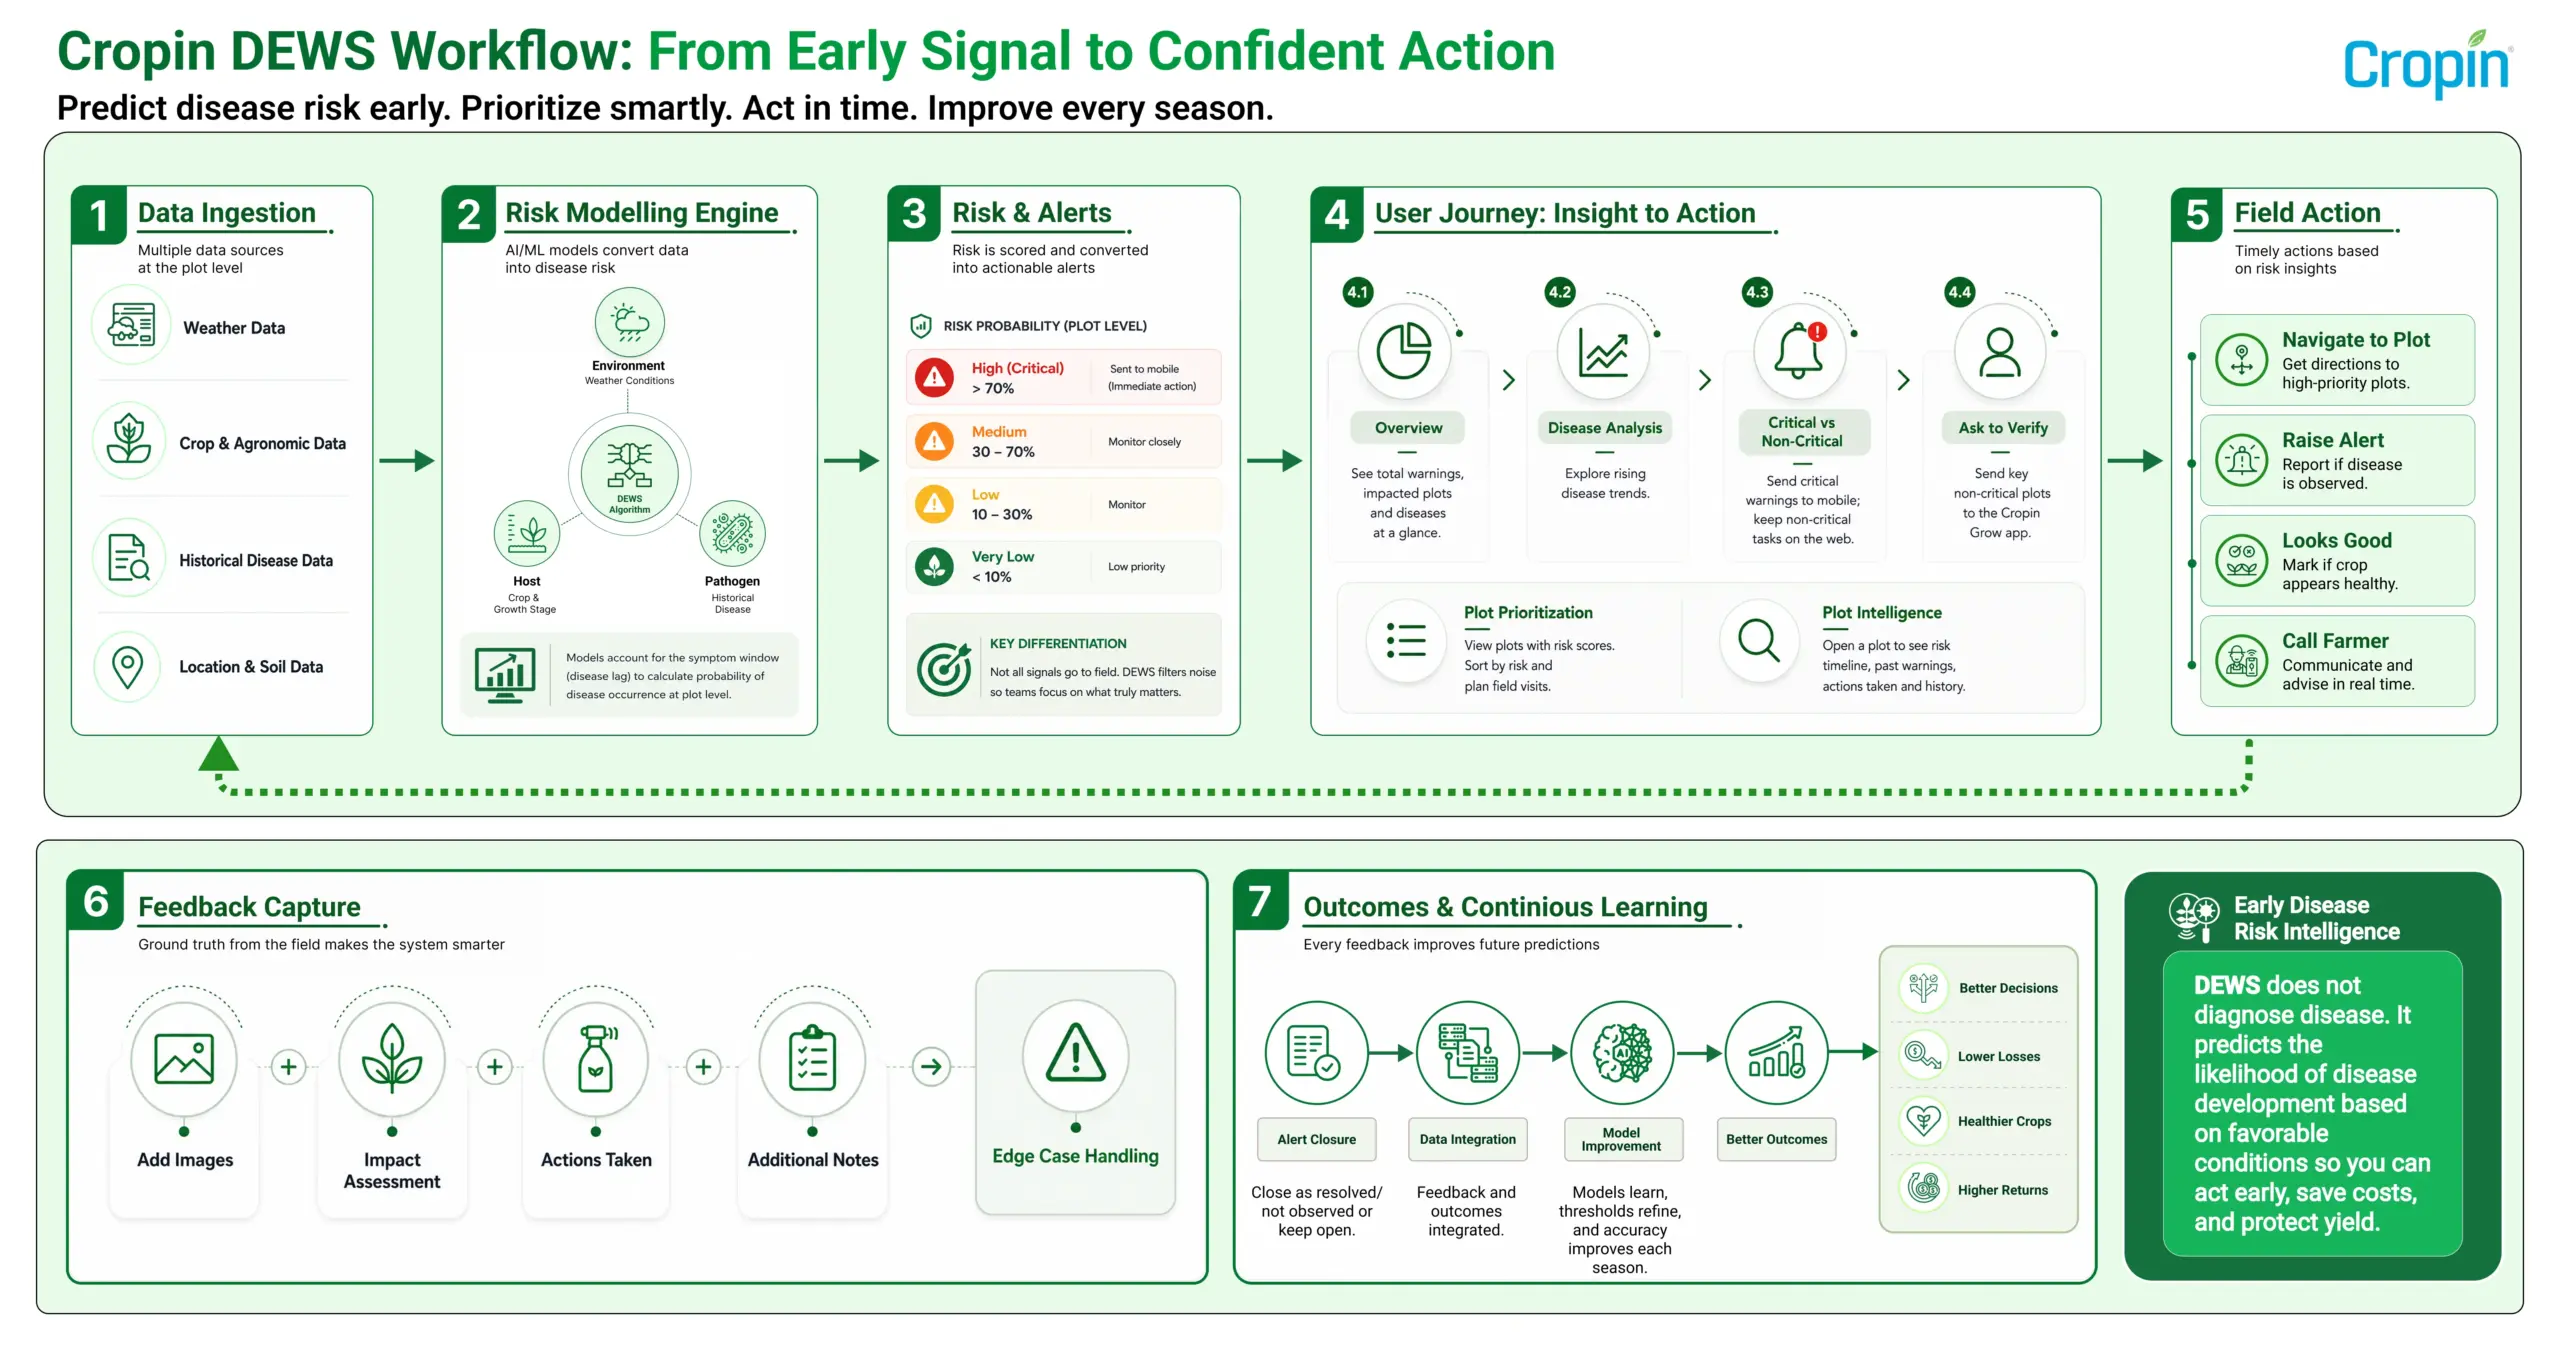
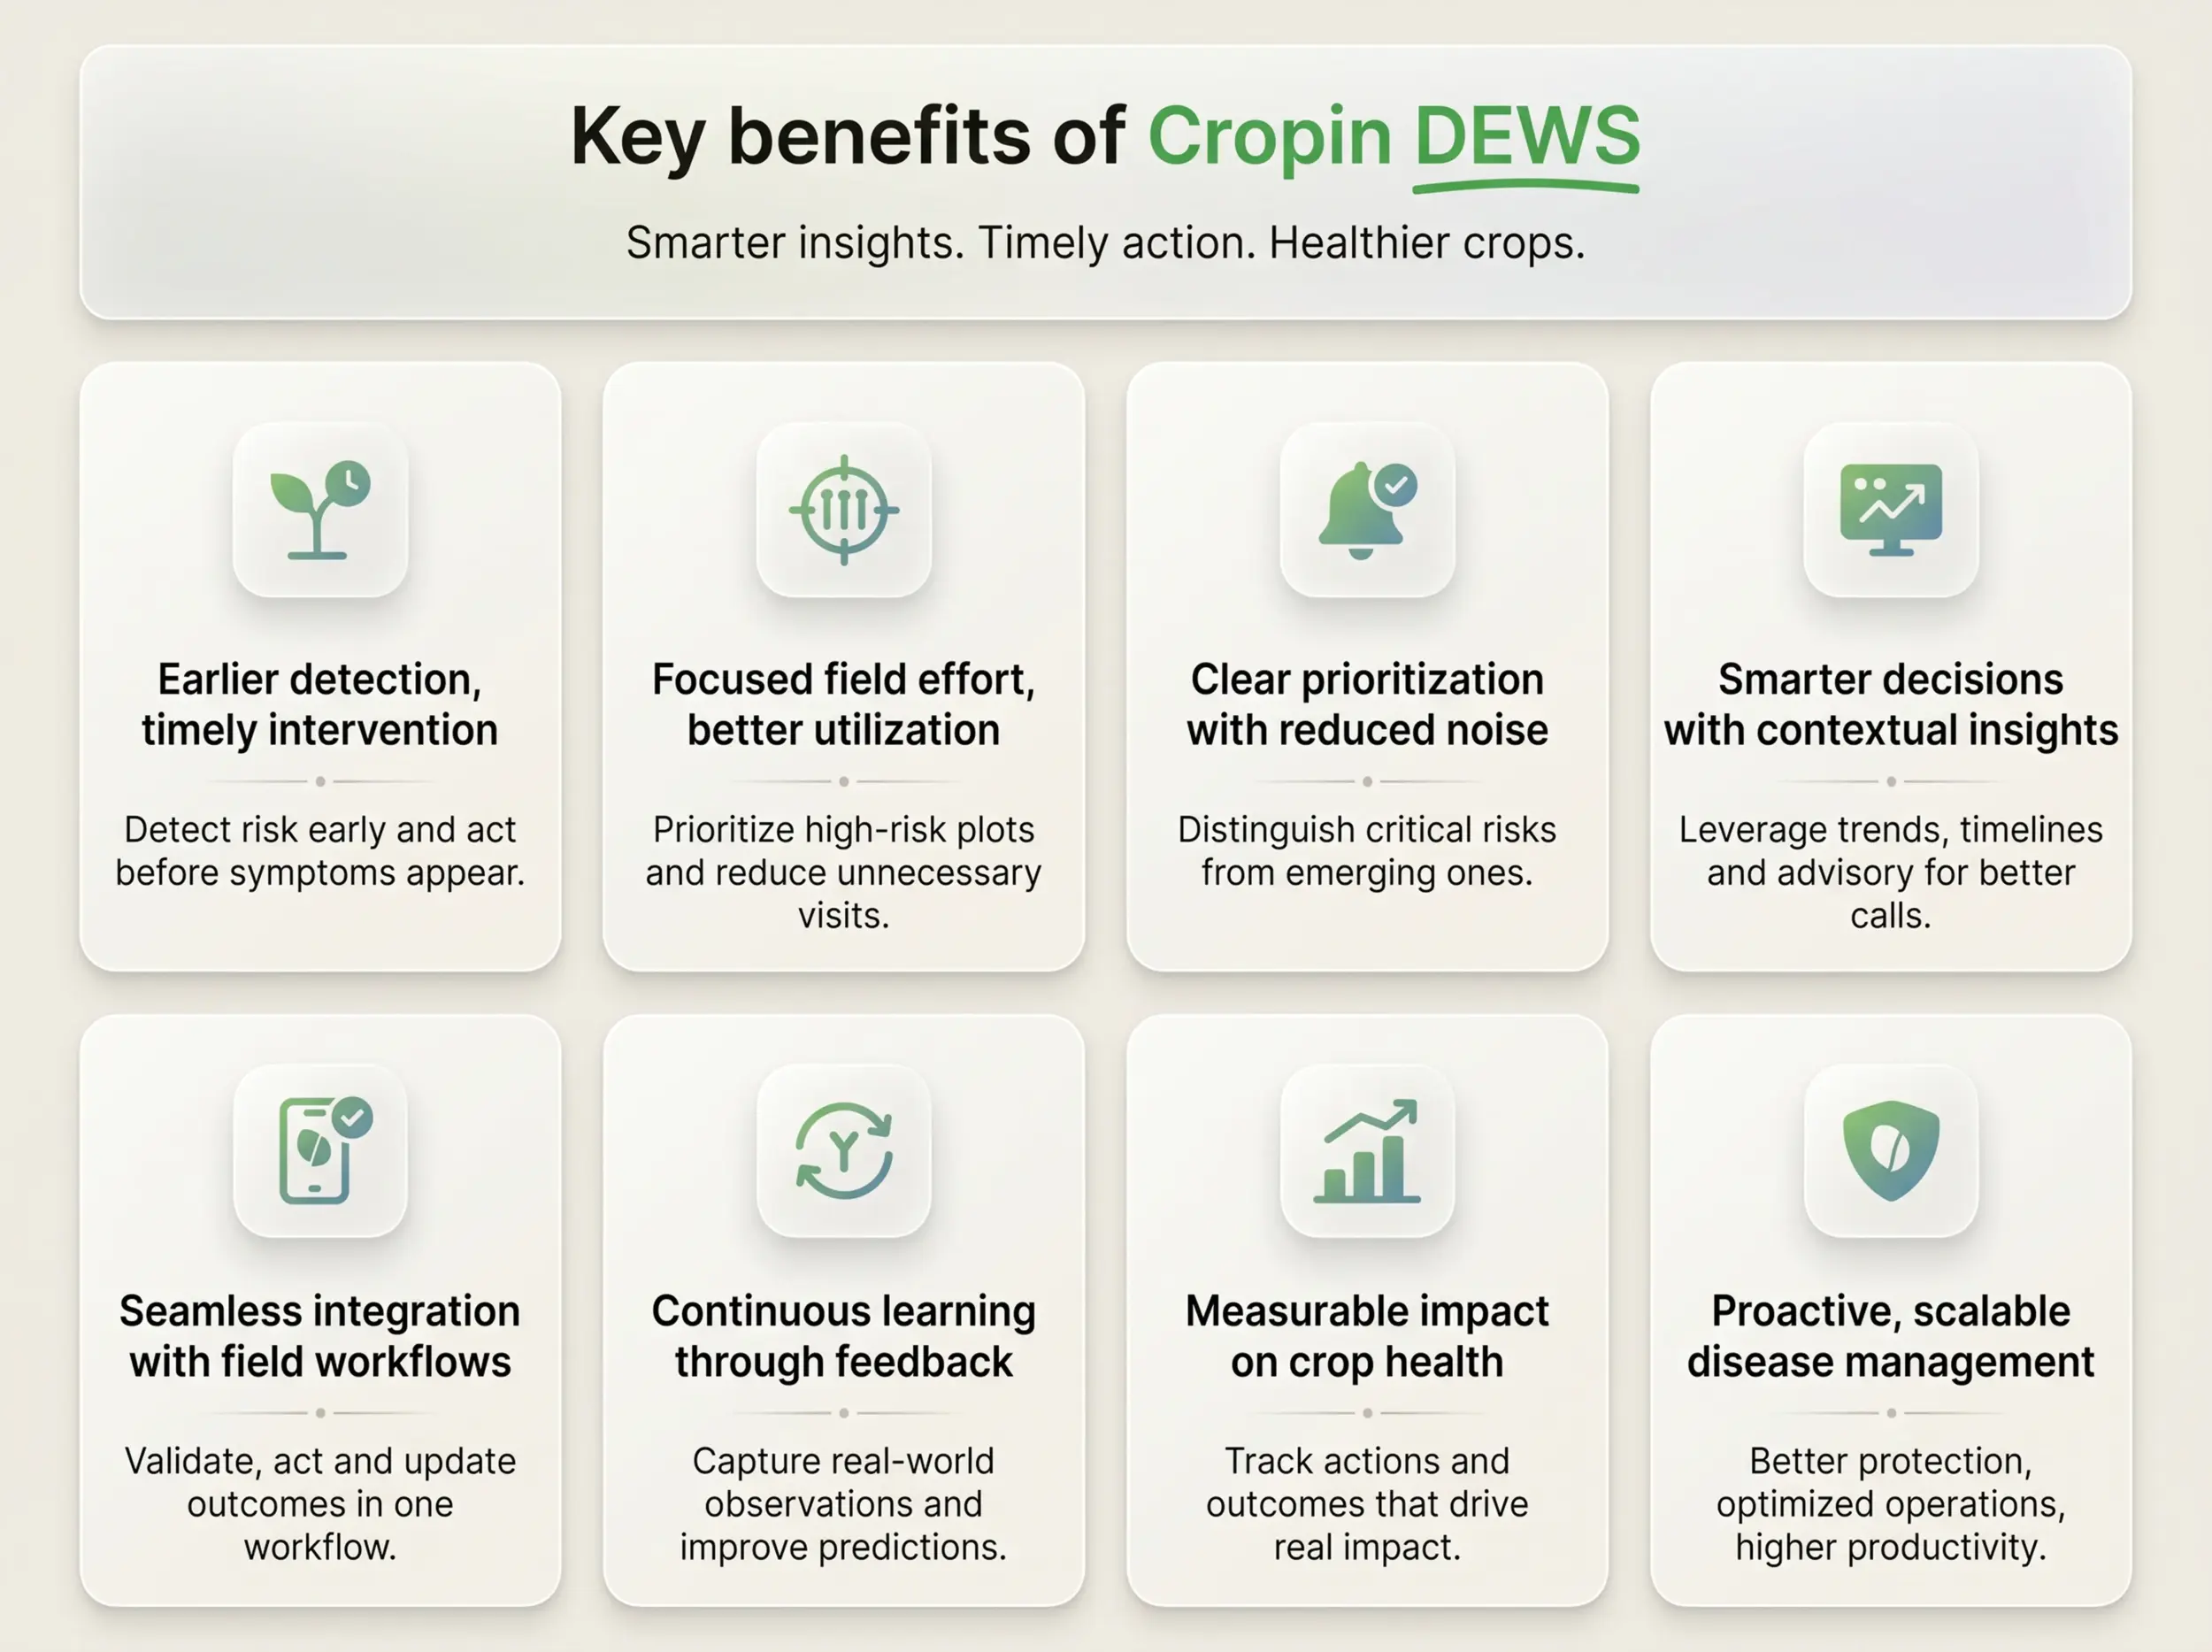
The Intelligence Engine: What is Cropin DEWS?

Cropin DEWS is a weather-driven probabilistic model that estimates the likelihood of disease occurrence at the plot level based on environmental and agronomic conditions. Rather than confirming whether a disease is present, DEWS identifies when conditions are favorable for disease development, giving field teams a critical early signal to act.
The model combines:
  • Real-time and historical weather data (like temperature, humidity, rainfall)
  • Crop and growth stage information
  • Historical disease patterns
These inputs are evaluated against disease-specific conditions to generate probability-based risk signals. Risk assessments are updated regularly, ensuring teams always have access to current and evolving insights throughout the crop cycle. This helps identify disease risk before visible signs appear in the field.
The early visibility allows teams to:
  • Prioritize high-risk plots
  • Plan visits based on expected disease timelines
  • Take preventive or mitigative action before the disease spreads
The result is a shift from reacting to disease after it appears to acting on risk when it matters most.

The Science Behind the Signal

Cropin DEWS is built on a well-established principle in plant pathology: disease outbreaks are not random. They occur when specific factors, namely the host, the pathogen, and favorable environmental conditions, align. The DEWS algorithm continuously analyzes a combination of:
  • Meteorological Features: Real-time and historical data on temperature (max/min/mean), relative humidity, and rainfall
  • Agronomic Factors: Crop variety and current growth stage
  • Historical Context: Past disease occurrences in the specific region
By mapping these features against disease-specific thresholds, DEWS accounts for the symptom window, the silent period between favorable conditions and visible damage. This lag varies by disease type, crop variety, growth stage, regional climate, and agronomic practices, and is calibrated by Cropin’s data science and agronomy teams. Understanding this window is what separates actionable intelligence from background noise. A high-probability signal indicates that conditions are conducive to disease development, allowing field teams to plan validation and intervention at the right time, rather than waiting for visible symptoms.

How the Warning System Works: A Multi-Tiered Approach

Cropin DEWS Workflow
As we saw earlier, disease risk begins to build silently during the symptom window. Traditional scouting relies on periodic field visits and visible symptoms, often reacting after the damage has already begun. It is clear by now that Cropin DEWS changes this approach by continuously monitoring conditions and identifying risk early.

Next, let’s understand how Cropin DEWS guides field teams from signal to action.

Early Detection Aligned with the Symptom Window

DEWS continuously analyzes weather conditions, crop stage, and historical patterns to identify when conditions become favorable for disease development. These signals are aligned with the symptom window, ensuring that validation and intervention happen at the right time. It provides teams with critical lead time to plan field visits, take preventive action, and reduce the risk of disease spread before it becomes visible.

Not All Alerts Are Equal: High Signal, Low Noise

In real-world conditions, too many alerts can reduce effectiveness. DEWS addresses this by structuring signals into two clear categories:
Critical Warnings: Triggered when probability scores cross a high-risk threshold. These demand immediate field validation and are available via both the web platform and the Cropin Grow mobile application. They form the primary basis for planning mitigative action.
Non-Critical Warnings: These represent lower probability or emerging risks. Primarily visible on the web platform, they serve as early signals for monitoring, alerting teams to developing conditions.
This layered approach ensures a high-signal, low-noise environment. It allows teams to focus on what matters most while still retaining visibility into developing threats.
Production Monitoring Dashboard on Cropin Cloud Platform
DEWS Dashboard on Cropin Cloud Platform

Ask to Verify: Not all risks require immediate action; some demand attention depending on context. A unique “Ask to Verify” workflow allows users to selectively escalate Non-Critical Warnings for field validation. These plots are pushed to the Cropin Grow application, enabling on-ground verification without overloading field teams. This ensures emerging signals are never missed and gives teams the flexibility to guide decisions by both data and field judgment.

All warning thresholds, model run frequency, and forecast intervals are configurable, allowing Cropin DEWS to be adapted to the specific risk tolerance and operational workflows of each deployment.
cropin
Cropin Dashboard Showing “Ask to Verify” Feature

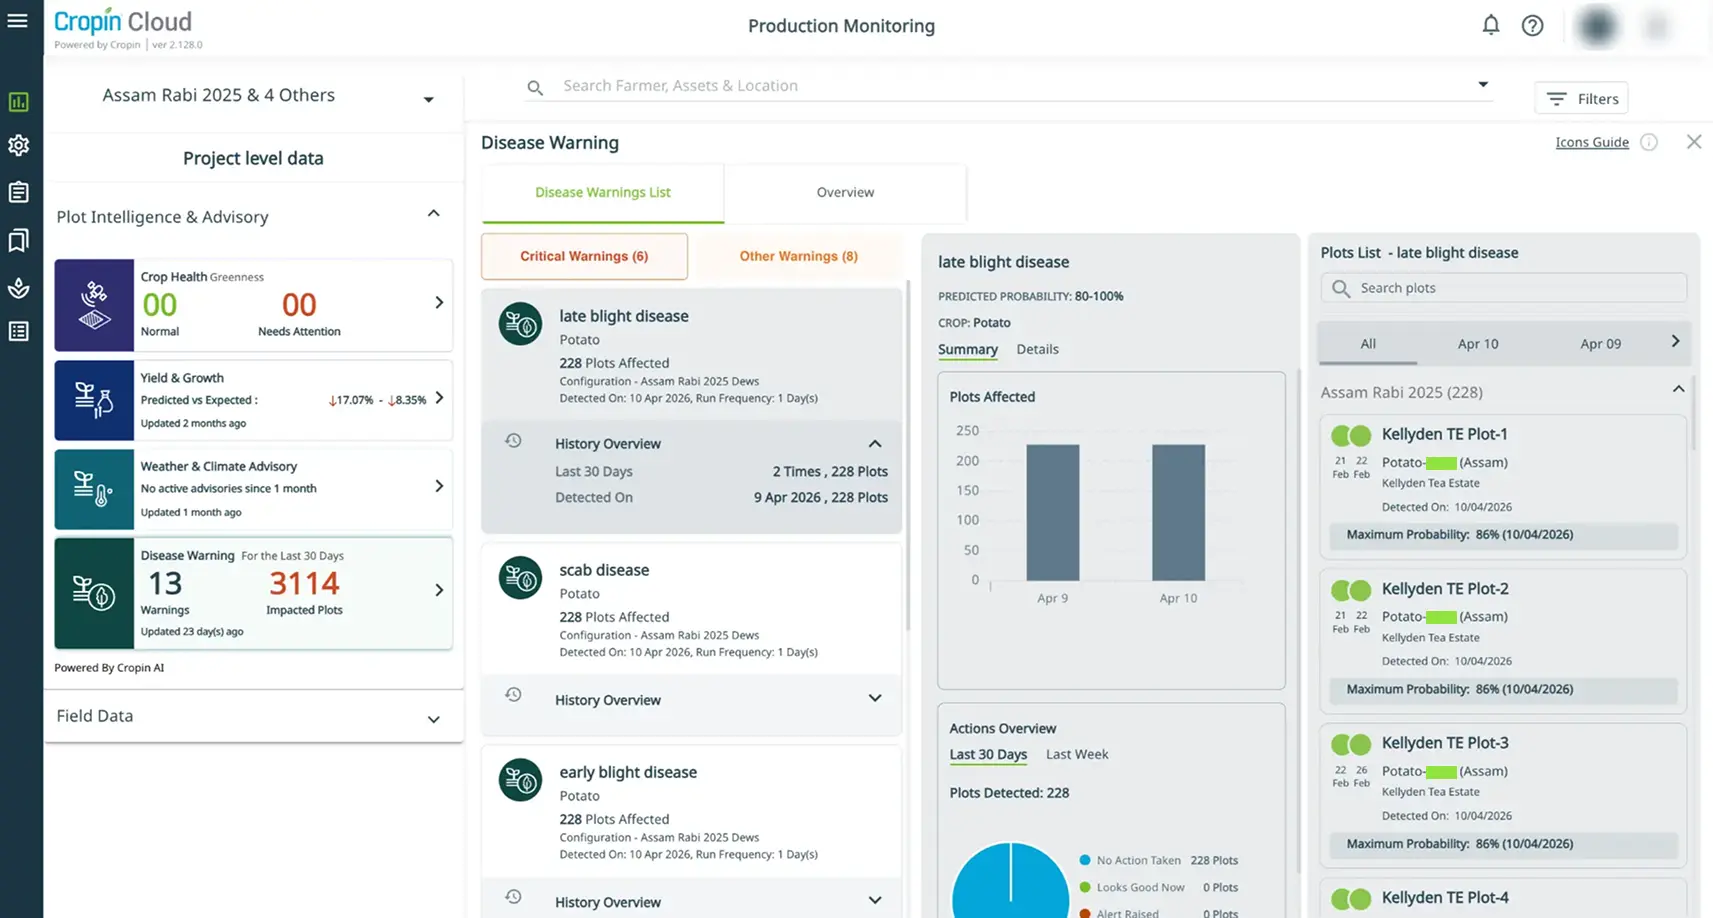
The End-to-End Workflow: From Warning to Resolution

Through continuous iteration driven by frontline field users, Cropin DEWS has matured from a simple alerting tool into a comprehensive, end-to-end decision support engine. It is designed to guide a user from high-level to deeper actionable insights.

The 30-Day Decision Window

Teams begin by identifying active diseases and trends, then move to a 30-day aggregated view of disease activity that aligns with the expected symptom window. This ensures that signals are not viewed in isolation but in the context of how risk evolves over disease progression over the past 30 days. Users can analyze:
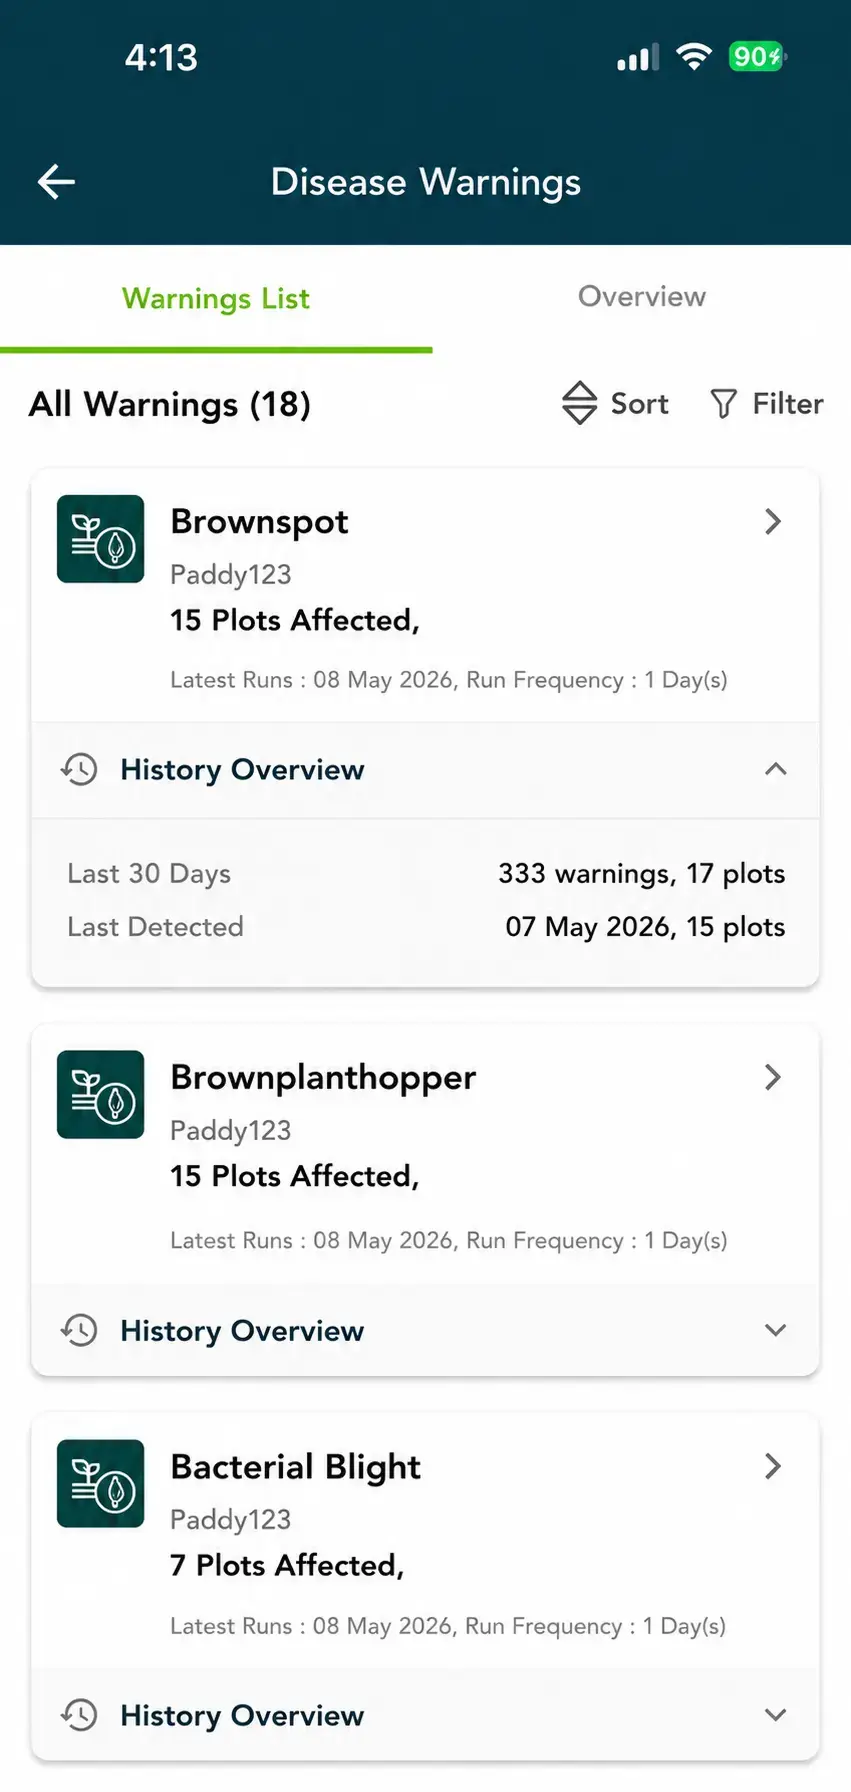
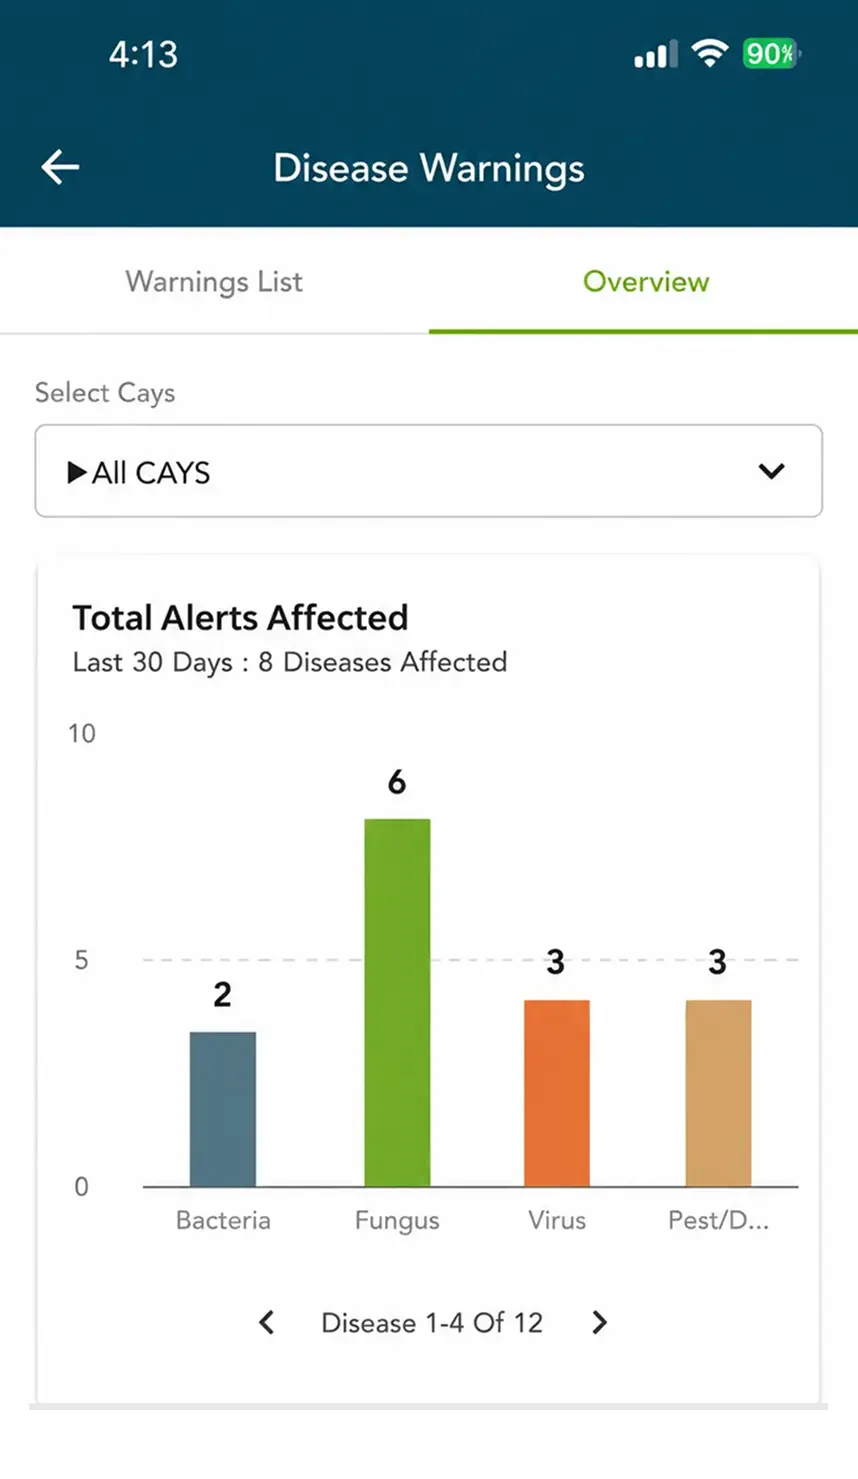
  • Summary Module: A project/user-level “command center” showing total warnings triggered and unique impacted plots.
  • Disease Intelligence: A ranked list of active threats with trend analysis (increasing, stable, or declining risk), aggregated insights, visual reference, and advisories.
  • Action Capture: Within the same workflow, field teams can update plot status, contact farmers, and record structured feedback (geo-referenced photos and observations).
This enables teams to understand not just what is happening, but when it is likely to translate into visible impact, allowing for more precise planning of field visits and interventions.

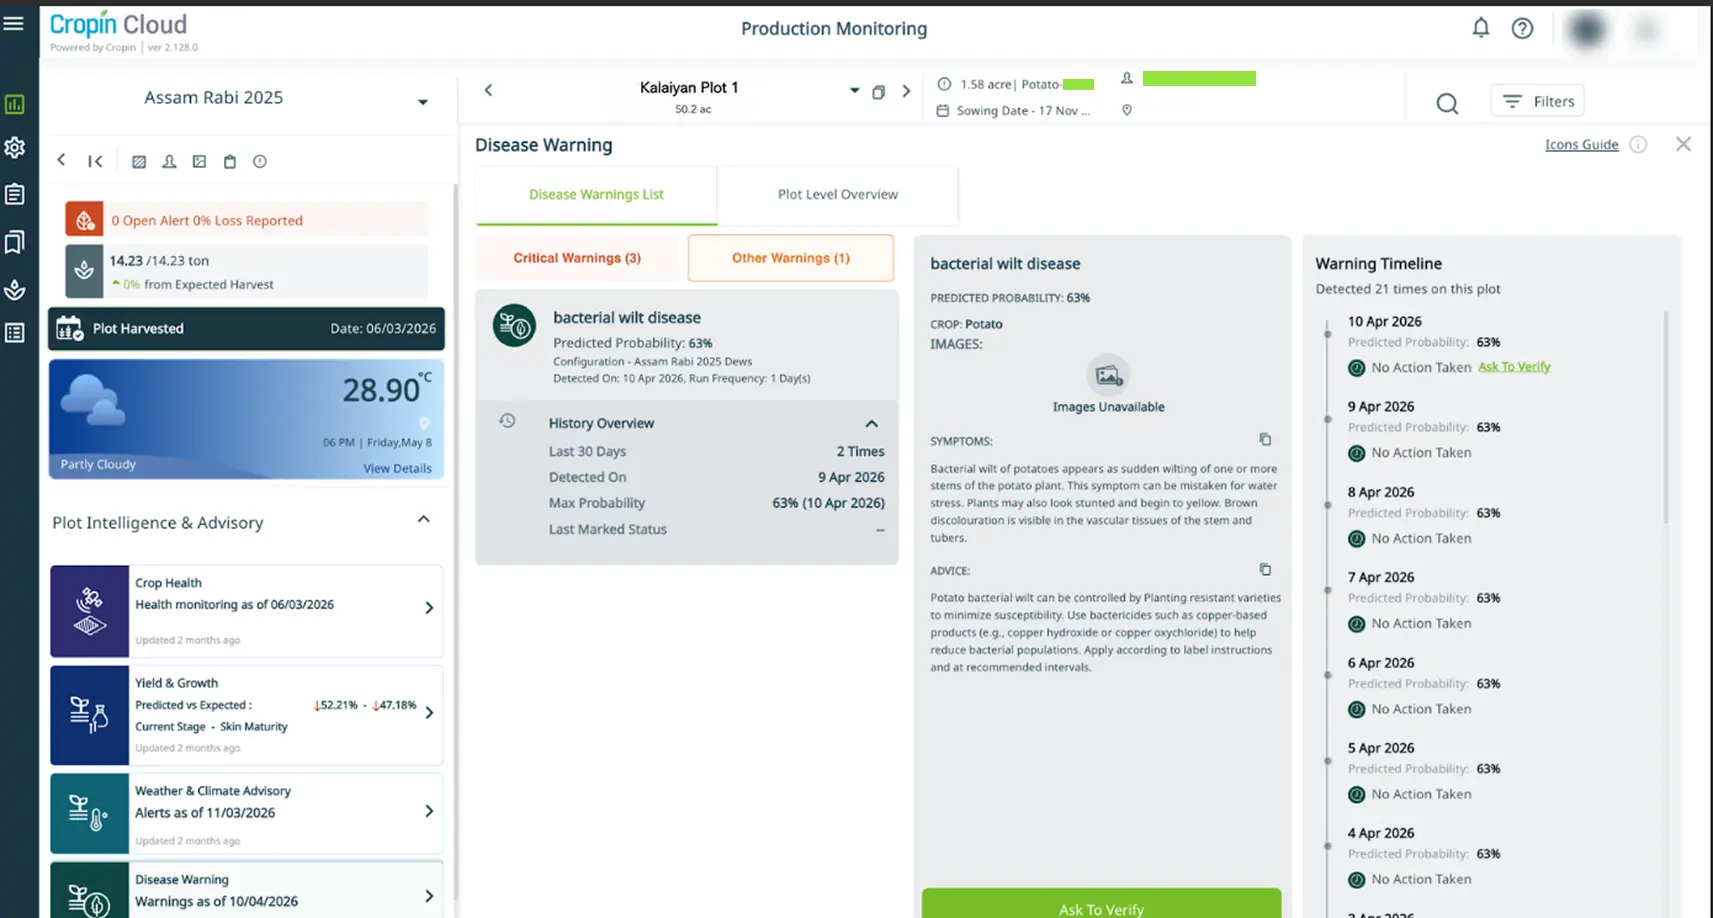
Plot-Level Prioritization and Intelligence

Once a disease is selected, DEWS provides a plot-level view, ranking all relevant plots based on probability scores. This allows teams to prioritize field visits effectively and focus on the highest-risk areas first.
At the plot level, DEWS provides a comprehensive timeline of disease risk and response, helping teams track how conditions have evolved and what actions have already been taken.
DEWS
Mobile view of alerts on Cropin App

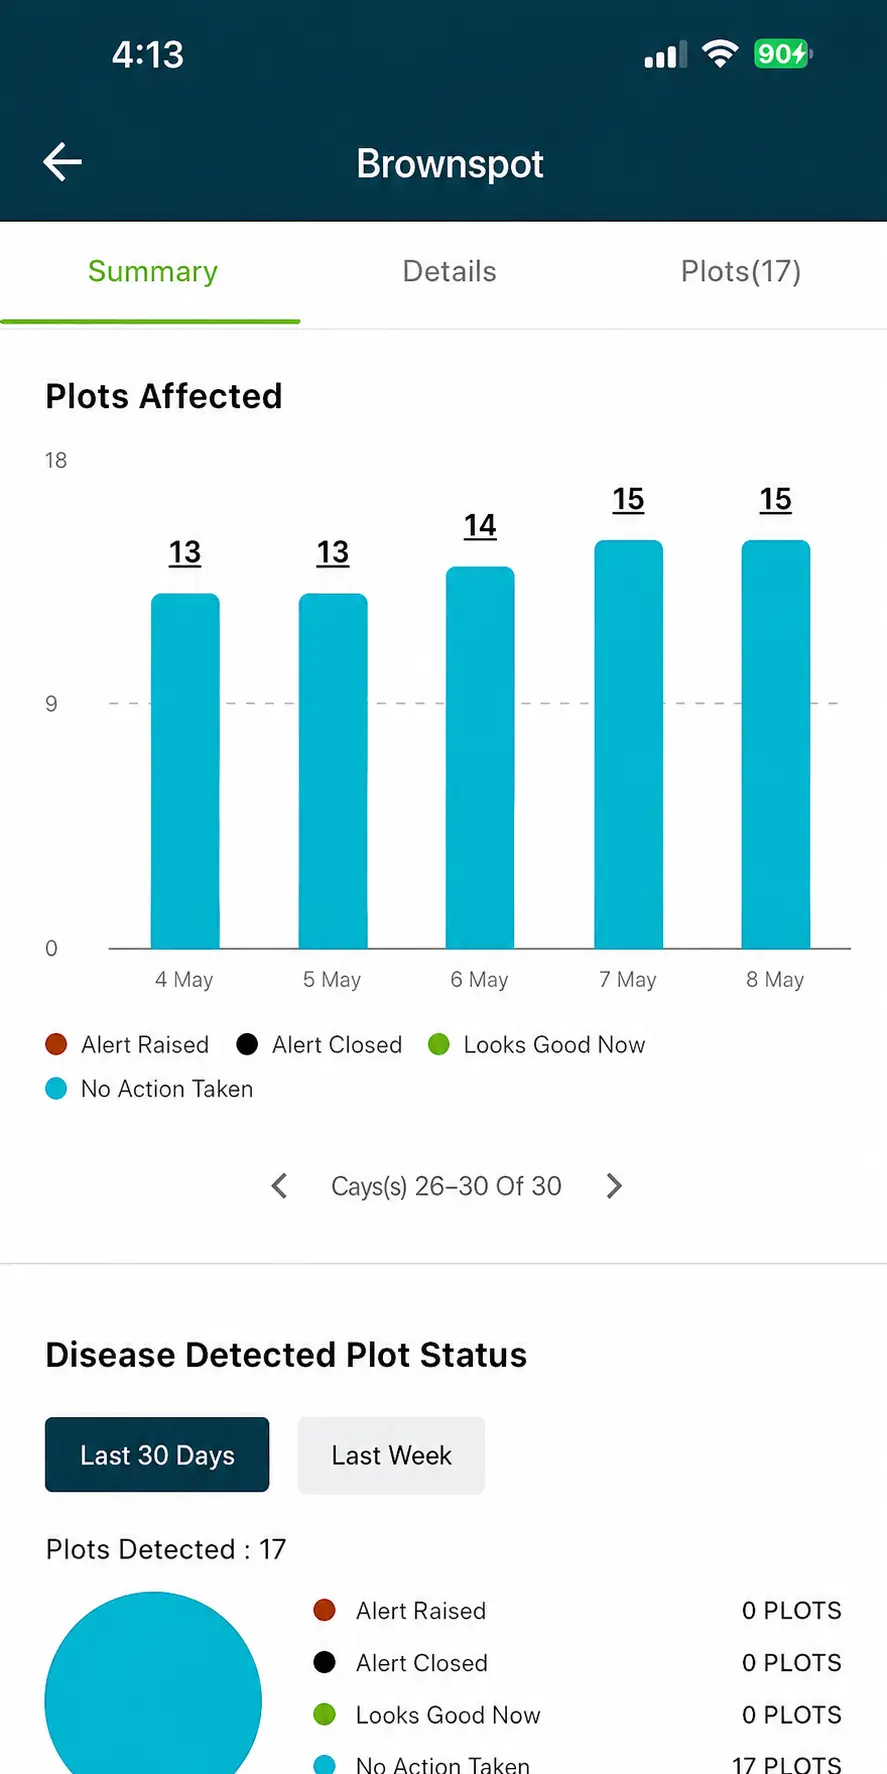
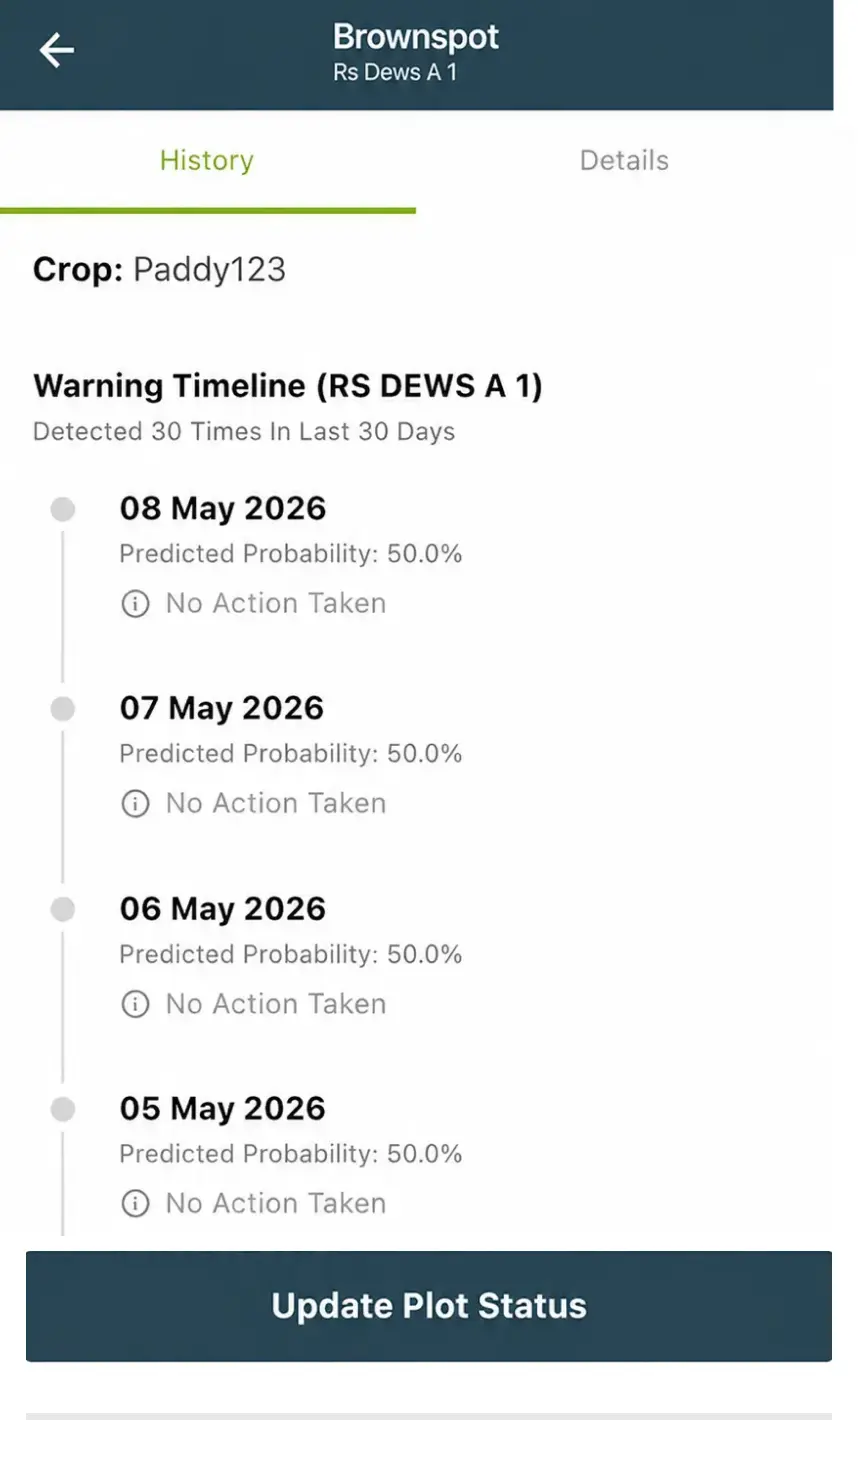
Contextual Plot Intelligence with Timeline Visibility

Each plot offers a complete view of disease activity over time, including:
  • Risk signals across the last 30 days
  • History of warnings triggered
  • Type of alert (Critical or Non-Critical)
  • Actions taken and their outcomes
  • Current alert status (open or closed)
By combining risk signals with action history, DEWS enables teams to understand how disease risk has progressed and how effectively it has been managed.

Action and Execution Within the Same Workflow

DEWS is designed for execution, not just observation.
Field teams can:
  • Validate conditions on-ground
  • Raise alerts when disease is observed
  • Mark plots as healthy where no issue is found
  • Record actions such as spraying or other interventions
By connecting signals directly to field actions, DEWS ensures that every alert leads to a clear and measurable response. It also allows teams to track how actions taken over time influence outcomes, strengthening the link between prediction and real-world impact.

Unpredicted Cases Closing the Feedback Loop

When a disease is observed in the field that the model did not predict, users can raise a Manual DEWS Alert. This ground-truth data is fed back into the system, allowing Cropin’s data scientists to identify model gaps and ensure the system gets sharper and more accurate with every passing season. The result is a structured workflow with feedback capture to improve accuracy.
By prioritizing only high-risk plots and filtering out noise, DEWS significantly reduces unnecessary field visits. Teams can focus their time and resources where they are needed most, improving productivity while maintaining coverage. This makes disease management not only more effective but also more efficient and scalable across large farming operations.

Real-World Proof: Space4Good × Cropin — Project CropLens

The most compelling validation of Cropin DEWS intelligence comes from Andhra Pradesh, India, where Space4Good and Cropin partnered to build CropLens. CropLens is a prototype early warning model for pests and diseases in transplanted rice paddy. The AI model combined in-situ field observations, satellite data, and meteorological data.
The pilot covered seven districts in West Godavari, East Godavari, Nellore, Guntur, Krishna, Prakasam, and Chittoor, with 500 farmers sampled per season across Kharif and Rabi cycles. The system generated spatial hotspot maps showing the distribution and severity of predicted pest and disease infestation, enabling farmers to track crop health, visualize risk, and receive actionable advisories.
The results were measurable and significant:
  • A 20% increase in productivity
  • A 15% reduction in fungicide expenses.
The project earned a EUREKA label supported by the Netherlands Enterprise Agency (RVO) and received European funding via the Globalstars India mechanism. An external validation of both the scientific rigor and the real-world impact of the approach.

Why This Matters Now

Plant diseases are among the largest contributors to food insecurity and loss for farmers. Climate volatility is making this worse, with shifting temperature and rainfall patterns altering the conditions under which diseases develop, in ways that traditional, experience-based scouting cannot anticipate. The cost of reactive management (excess agrochemicals, emergency interventions, and irrecoverable yield loss) is a burden no modern agribusiness can afford. Agribusinesses, governments, and development organizations increasingly need tools that shift the economics of disease management from reaction to prevention.
Cropin DEWS represents a fundamental shift in the economics of farming. Deployed at scale, it moves teams away from simply tracking problems toward measuring outcomes: plots protected, alerts validated, and yields secured. It is not just a dashboard; it is a decision engine built to protect your harvest before the damage begins.

Ready to Get Ahead of Crop Disease?

If your field teams are still responding to disease after symptoms appear, you are already behind. Cropin DEWS gives you the lead time, the workflow, and the feedback loop to change that.
What is predictive agriculture, and how does it improve supply chain efficiency?
Predictive agriculture uses AI and data analytics to forecast crop yields, demand, and risks. It improves efficiency by enabling better planning, reducing waste, and optimizing resource use across the supply chain.
It identifies potential disruptions, such as weather events or logistics delays, in advance, allowing businesses to take proactive measures and minimize impact.
Businesses benefit from cost reduction, improved yield quality, reduced waste, and higher profitability, resulting in strong ROI.
It helps farmers adapt to climate variability, optimize resource usage, and reduce environmental impact, supporting sustainable agriculture practices.
Agribusinesses, food processors, retailers, exporters, and supply chain operators benefit significantly from improved forecasting, efficiency, and risk management.

Author Bio

Prakhyath Hegde

Prakhyath Hegde is the Senior Vice President of Engineering at Cropin, the world's largest deployed AI platform for food and agriculture, bringing over two decades of experience in building hyper-scale software and AI-powered products. At Cropin, he is instrumental in leading the engineering for all platforms, including developing its multi-tenant, micro-services based Cloud & SaaS digitization platform. His work focuses on converging farm digitization data with advanced intelligence outputs from AI, ML, data science, satellite imagery, and remote sensing. A passionate problem-solver, Prakhyath previously held leadership roles at Samsung Research Institute and Viacom18, and has authored multiple scholarly articles and holds international patents.

Similar blogs

Scroll to Top
?
?
?